
Enterprise users only. Building and populating a report from scratch is available to Enterprise users only. If you placed a standard order, your report is built and delivered directly to your workspace, and you do not need to create or configure it yourself. To get started with your delivered report, see How to Read Your Report.
Page
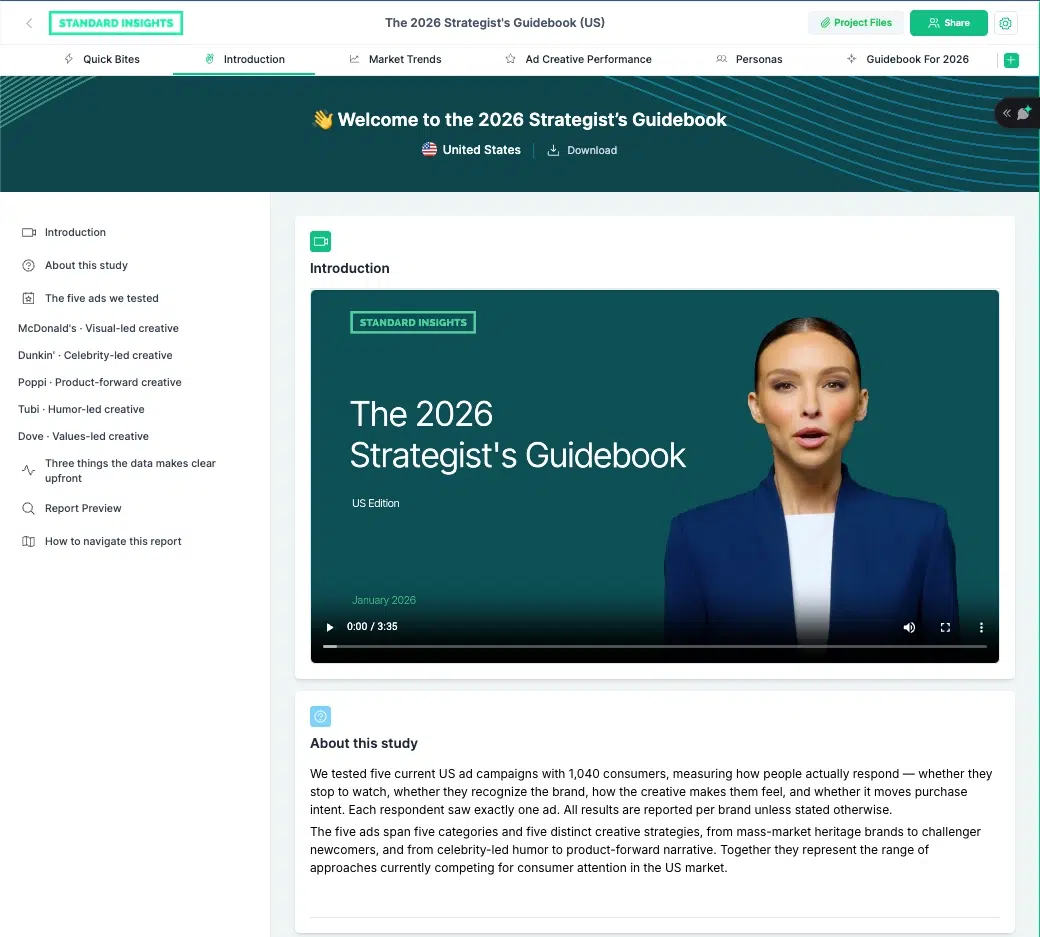
A blank format for tailored written content. You can add free text, images, videos, tables, and charts. AI Chat is available on this page type and interacts with the content you have added.
Use a Page when you need a flexible format for introductions, written analysis, or any content that does not fit a structured data view.
Paid projects: On paid projects, the Introduction and Strategic Analysis pages use this format. The content and videos on these pages are produced by the analyst team and are not automatically generated.
Notes
A straightforward text editor. You can drop in notes and add content freely, without formatting constraints.
Use Notes to prepare report notes or collaborate with colleagues during the build process.
Board
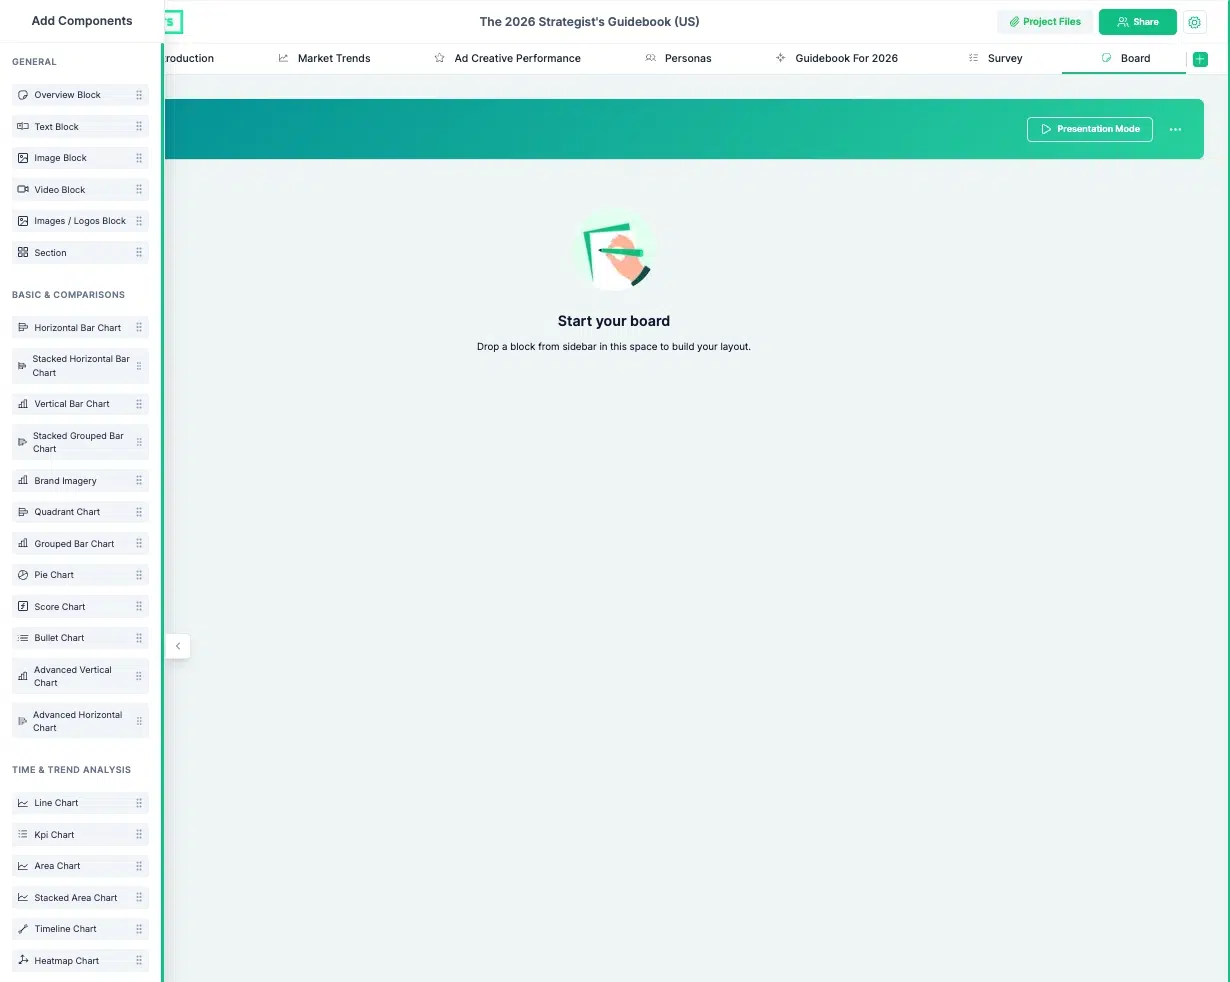
A blank canvas with over 50 chart types. Charts are fully customisable. Most charts include individual AI analysis, and there is also a whole-board AI page analysis that reviews everything together. Presentation mode lets you present the Board directly to an audience without leaving the platform.
Use a Board when you need to build a custom data visualisation from scratch, or when you are preparing to present findings live.
Survey
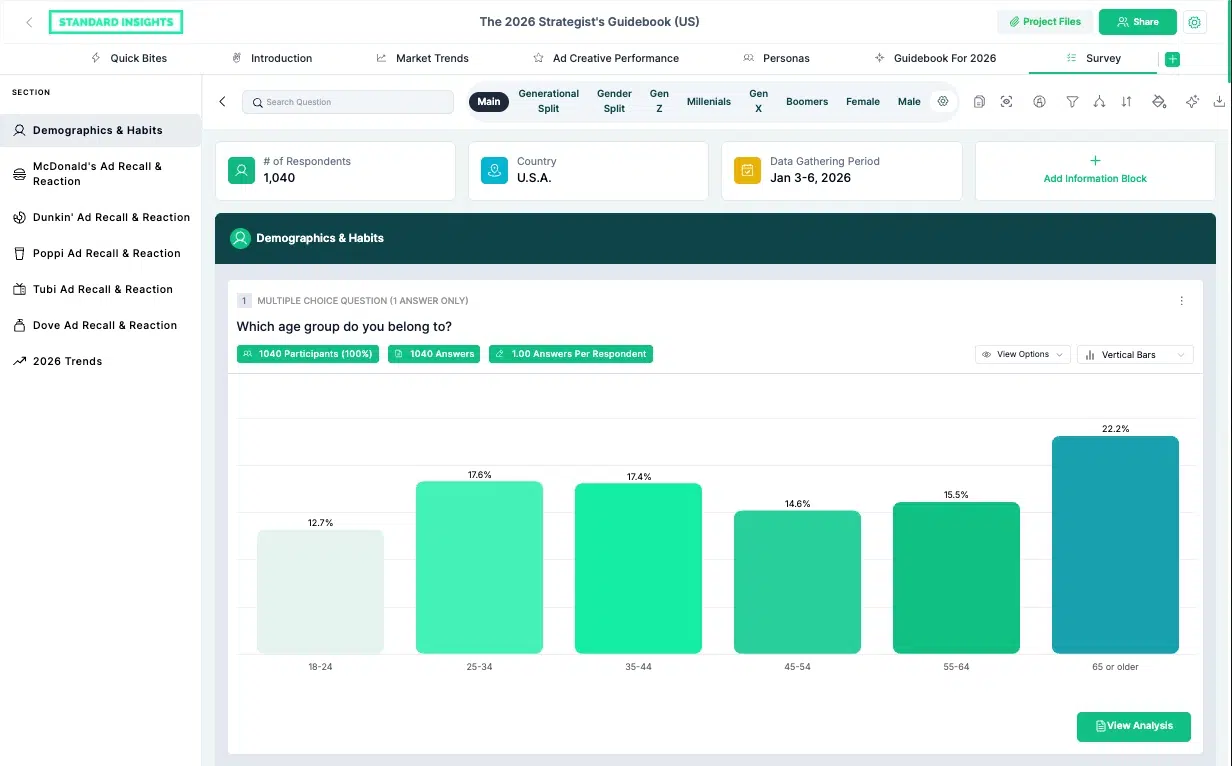
The Survey page converts your survey data into visualisations. Data can be imported from pre-mapped platforms including SurveyMonkey and Qualtrics. Each question is rendered as a chart and can be customised individually.
Available functions include Filter, Split, and Compare, as well as question reordering, hide and display controls, Sections that act as chapters, information blocks, saved cross-tab views, and colour customisation.
AI analysis is available per question and per section, in any language and in multiple length formats. Charts export as editable objects in PPT, not as images.
Use the Survey page as the foundation of your report. Several other page types, especially Insights and Personas, connect directly to Survey page data, so build this page before creating those.
Enterprise: During onboarding, Enterprise clients receive a dedicated data format that allows survey data to be uploaded directly without reformatting.
Interview
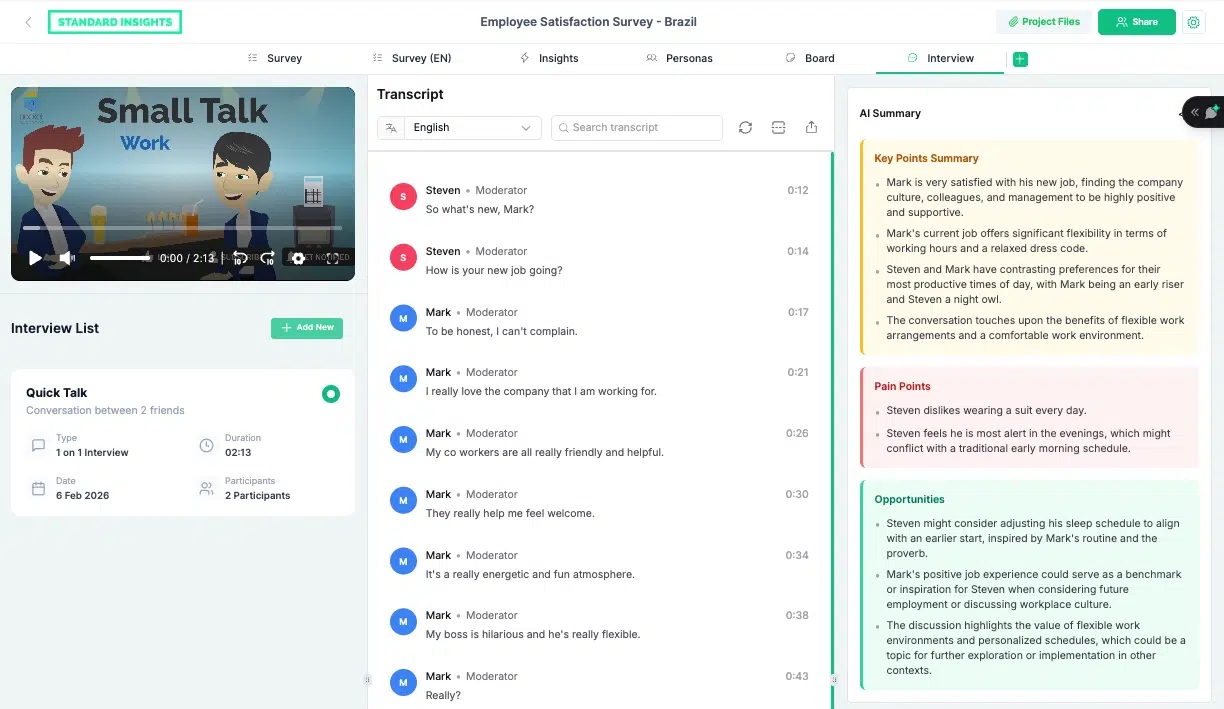
An upload space for qualitative research, including focus group transcripts, one-on-one interview recordings, or any other qualitative material. Keeping this alongside your survey data means your quantitative and qualitative findings live in one place within the same report.
Use an Interview page when your project includes qualitative research that should be reviewed alongside the survey data.
Market Trends
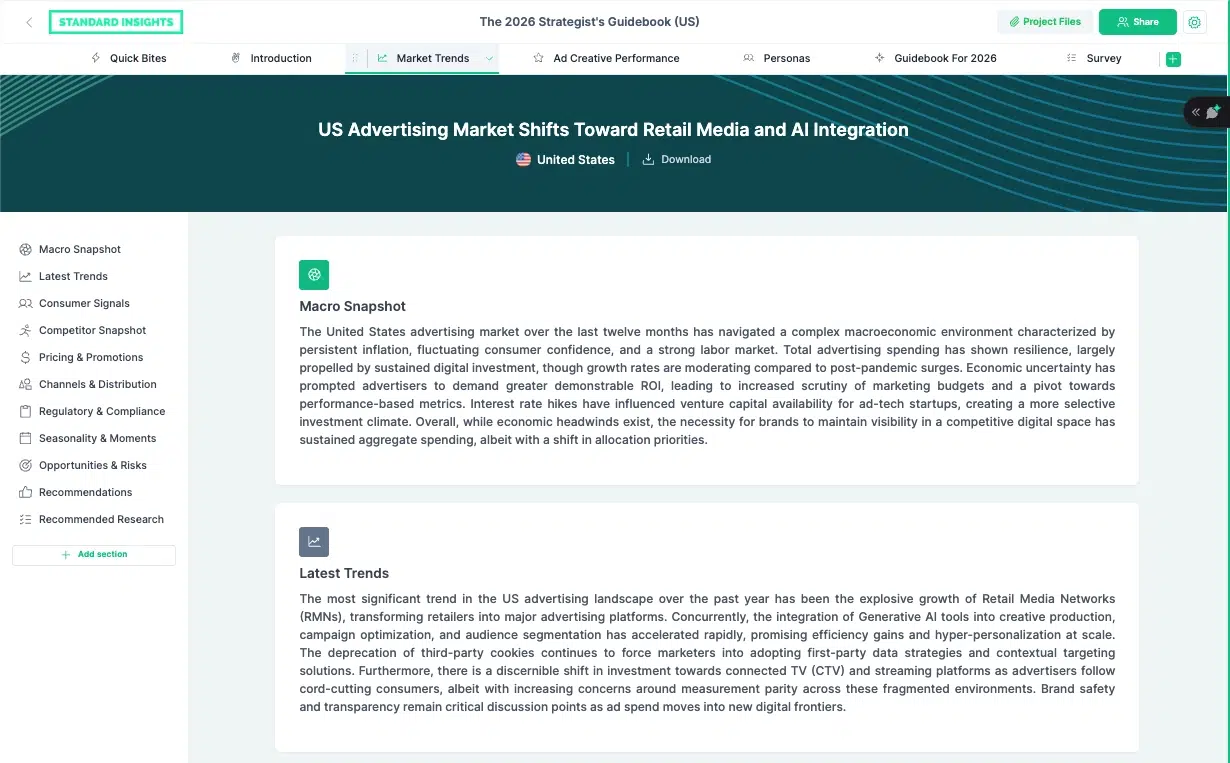
An automated page that gathers secondary data on any topic and country of your choice. You define the topic, the country, and the time range, and the platform fetches relevant industry data to populate the page. AI Chat is available to ask questions about the industry data.
Use Market Trends when you need secondary market context to sit alongside your primary research.
Insights
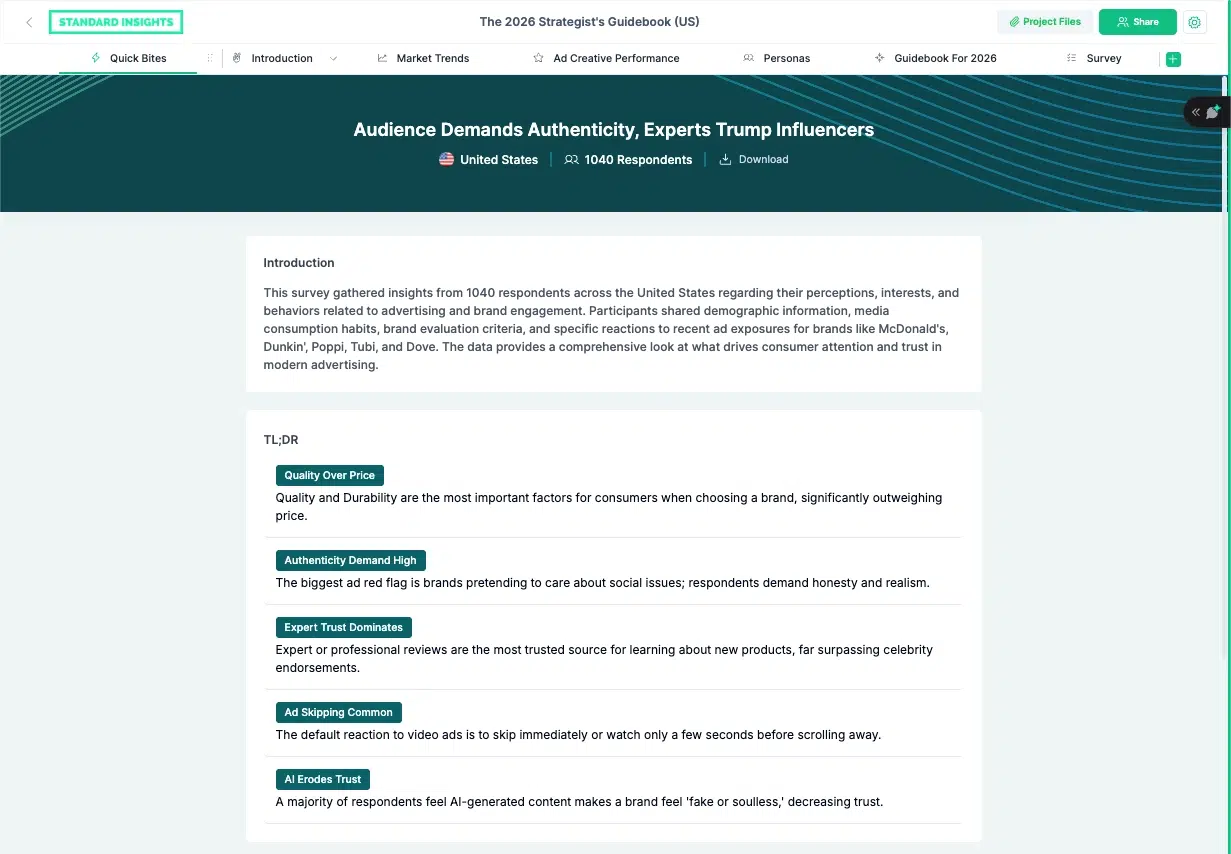
An automated page connected to your Survey page data. It generates key takeaways from the survey dataset. AI Chat is available and lets you interact with the full project data.
Use an Insights page when you want the platform to surface headline findings from your survey data without building a Board manually.
Personas
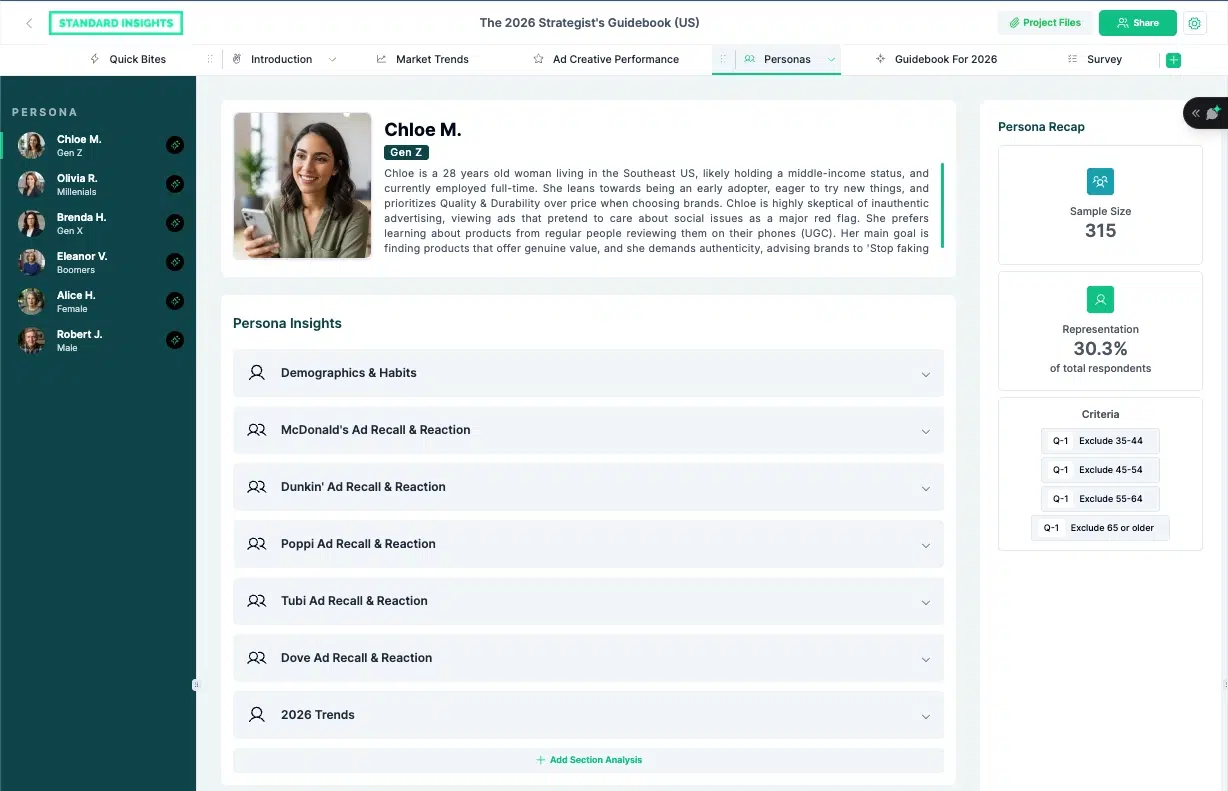
Also connected to your Survey page data. Personas are defined by the filters you apply when creating them, for example filtering to female respondents only. The platform then generates key takeaways and dedicated insights per section.
A few things to know before you build:
- Sections must be created in the Survey page first. Build your Survey page before creating personas.
- The right-hand column shows sample size, representativeness compared to the overall sample, and a recap of the filters applied.
- All analysis fields are fully editable, including the persona image.
- AI Chat is available and lets you interact directly with the persona's data. This is useful for testing concepts without re-running a study, but the questions should stay grounded in what the survey actually covered.
- Once a persona is created, returning to the Survey page will show a saved view for that persona automatically.
Use Personas when you need to define and explore distinct audience segments within your survey data.
What's Coming
The following features are in development. This section will be updated as they ship.
- AI Chat centralisation: currently activated per page; will be centralised so you can chat with any page from anywhere in the report
- Report data indexing: back-end improvements to increase AI Chat capabilities and allow more detailed questions
- Board page optimisation: layout and option improvements based on usage patterns
- Interview page optimisation: UX improvements and additional features
Once your report is built, the next step is sharing it with stakeholders or exporting it for presentation. See How to Share and Export Your Report — Sharing with Colleagues, Downloading, Presenting to Clients for a full walkthrough.