
Easily create market research reports that people read, understand, and want to share.
No credit card required
Research reporting often feels like a time-consuming chore, preventing you from uncovering the story within your data.
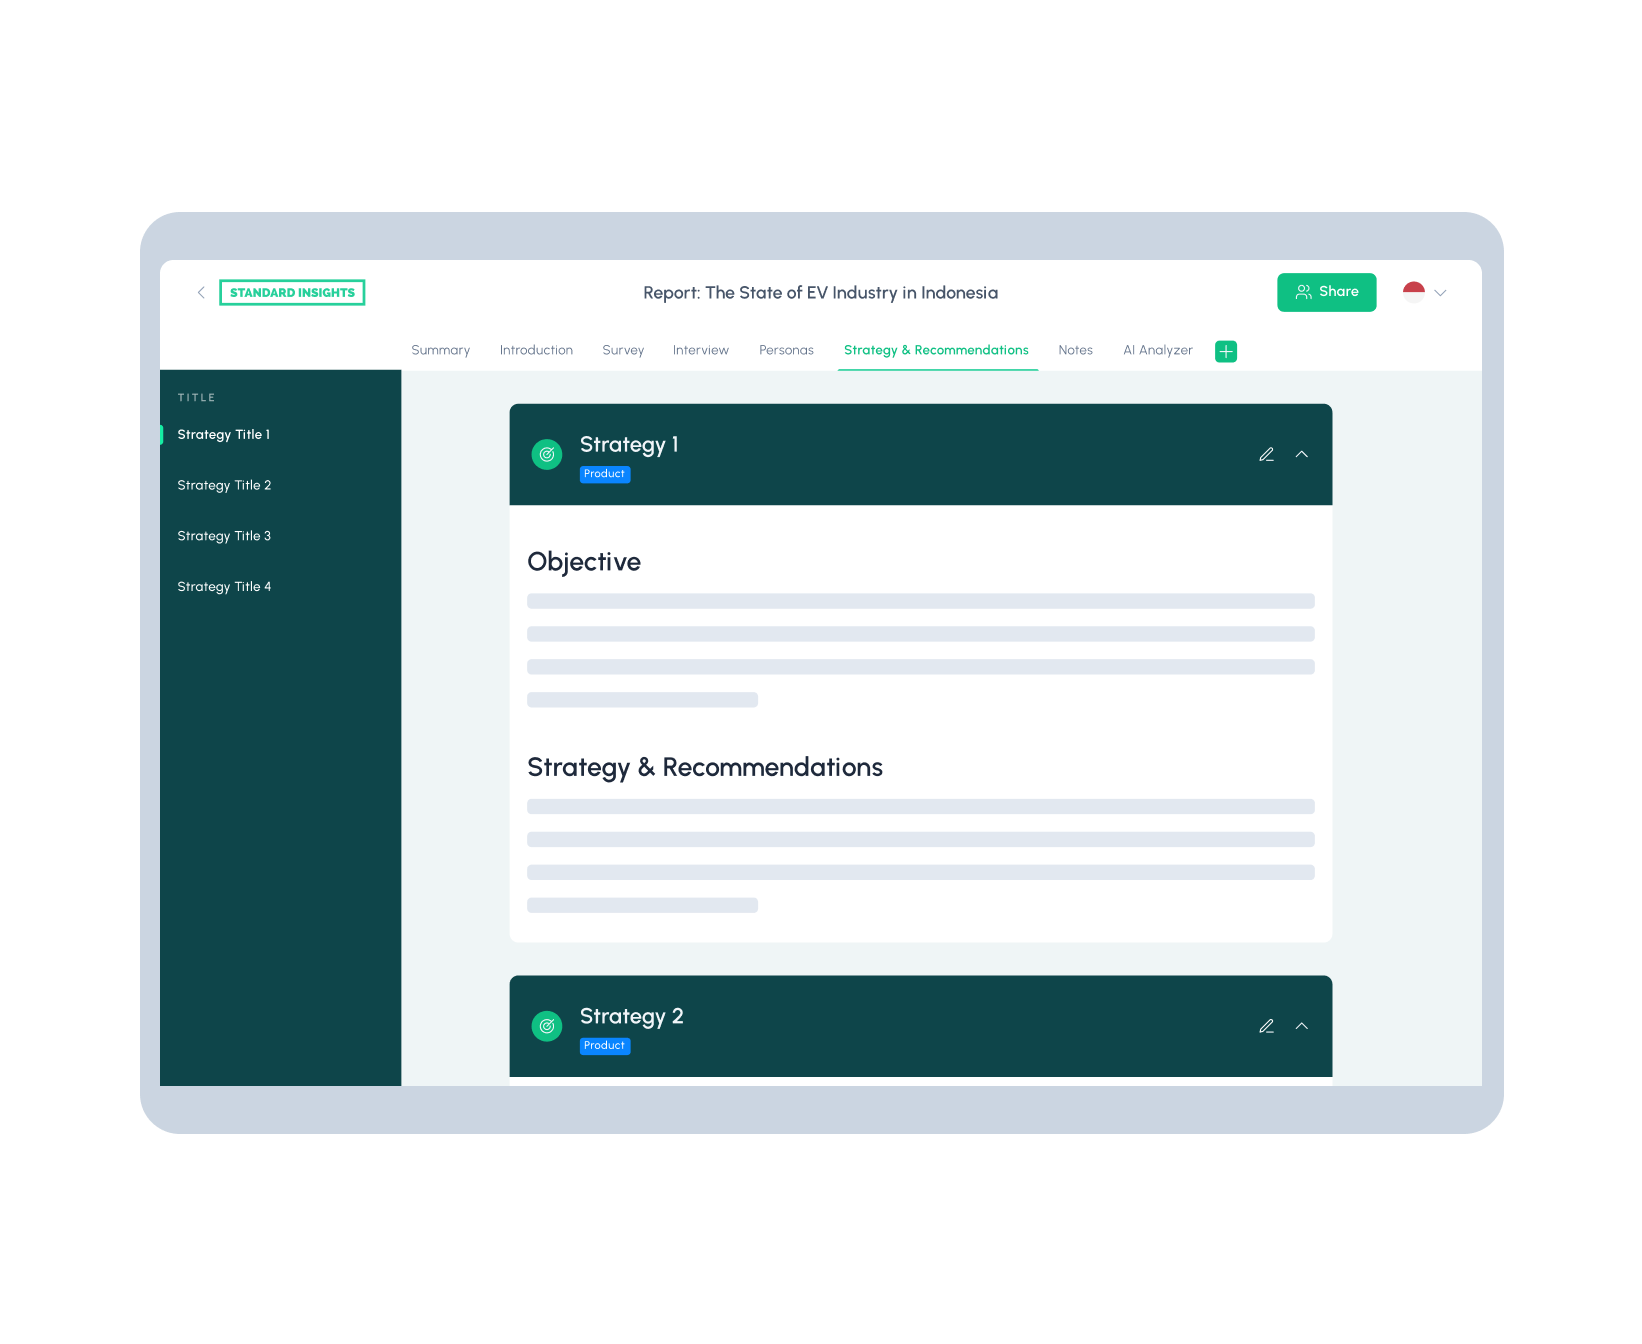
Reporting should be an exciting conclusion to your research, a moment to engage your team in planning future actions.
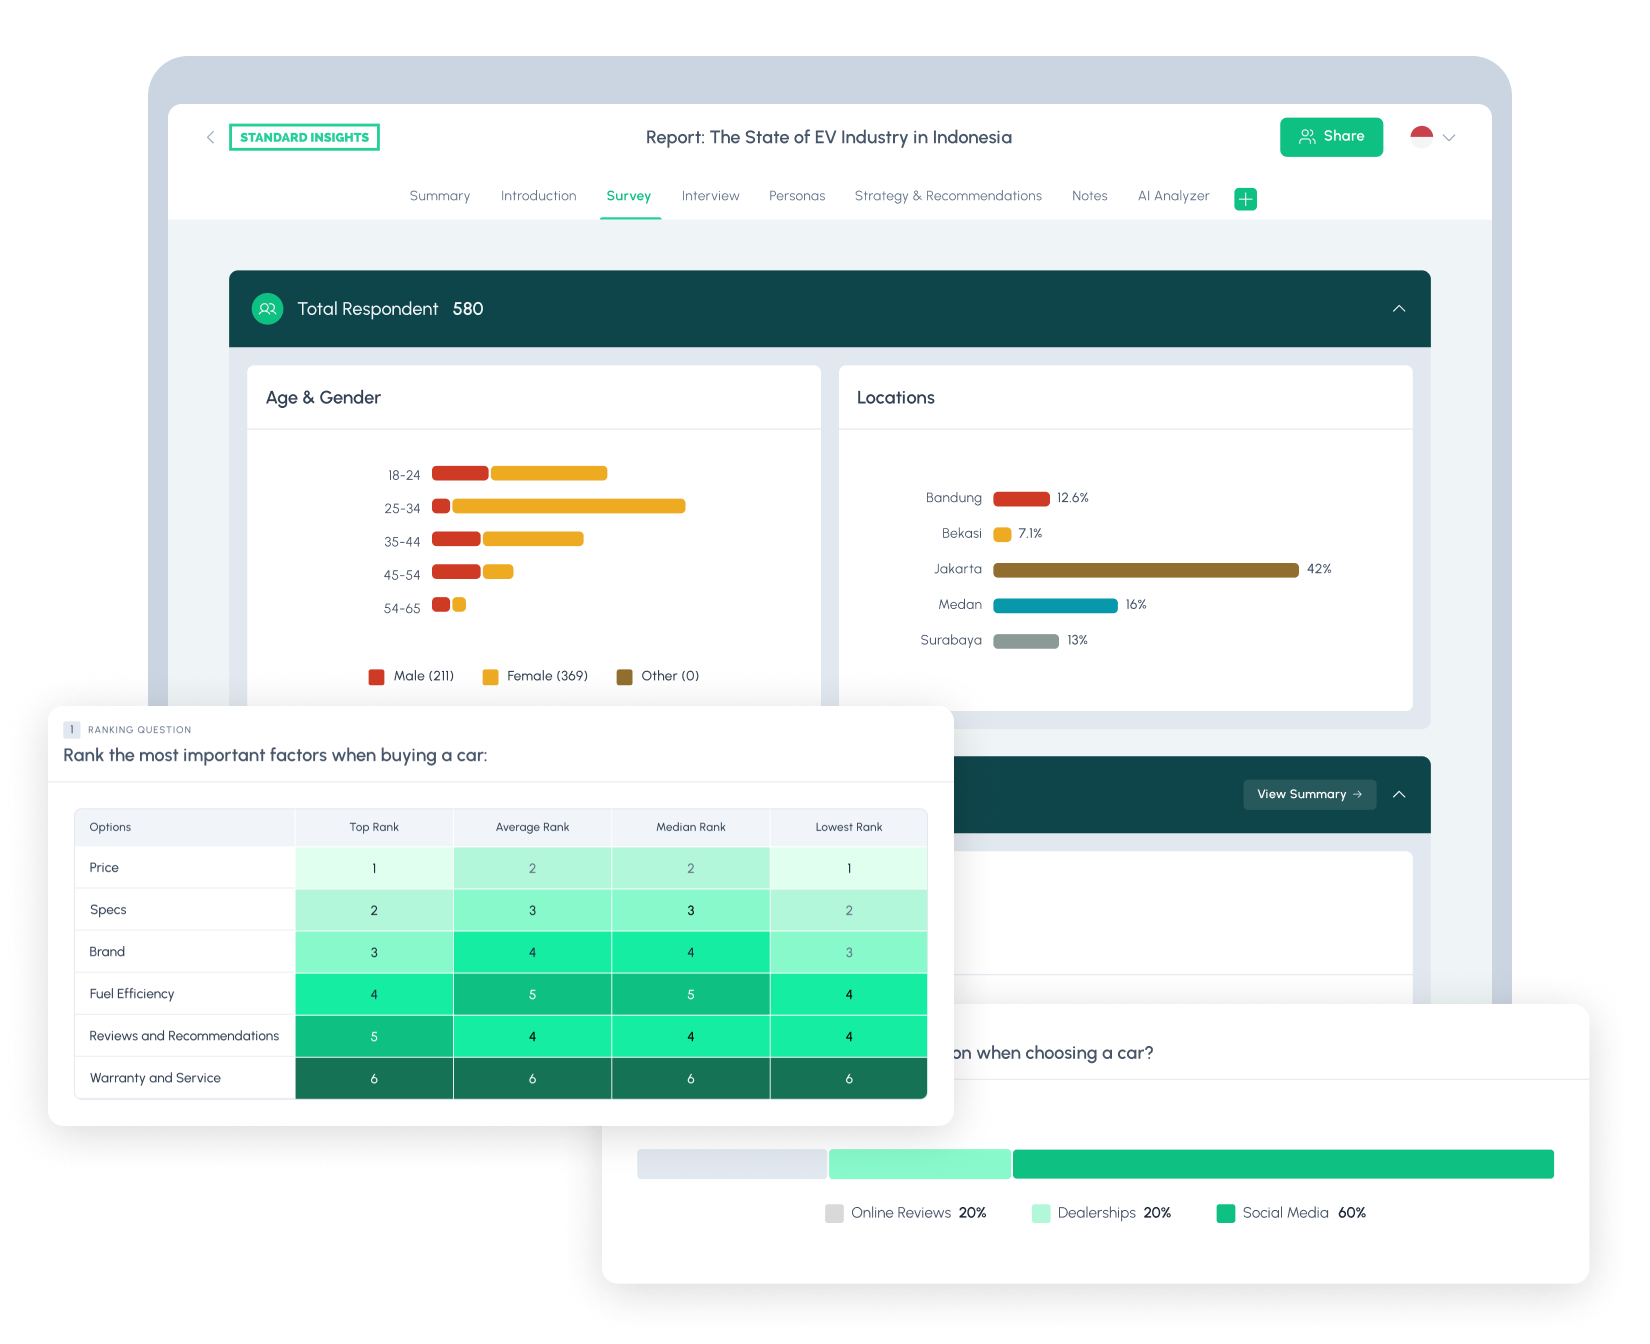
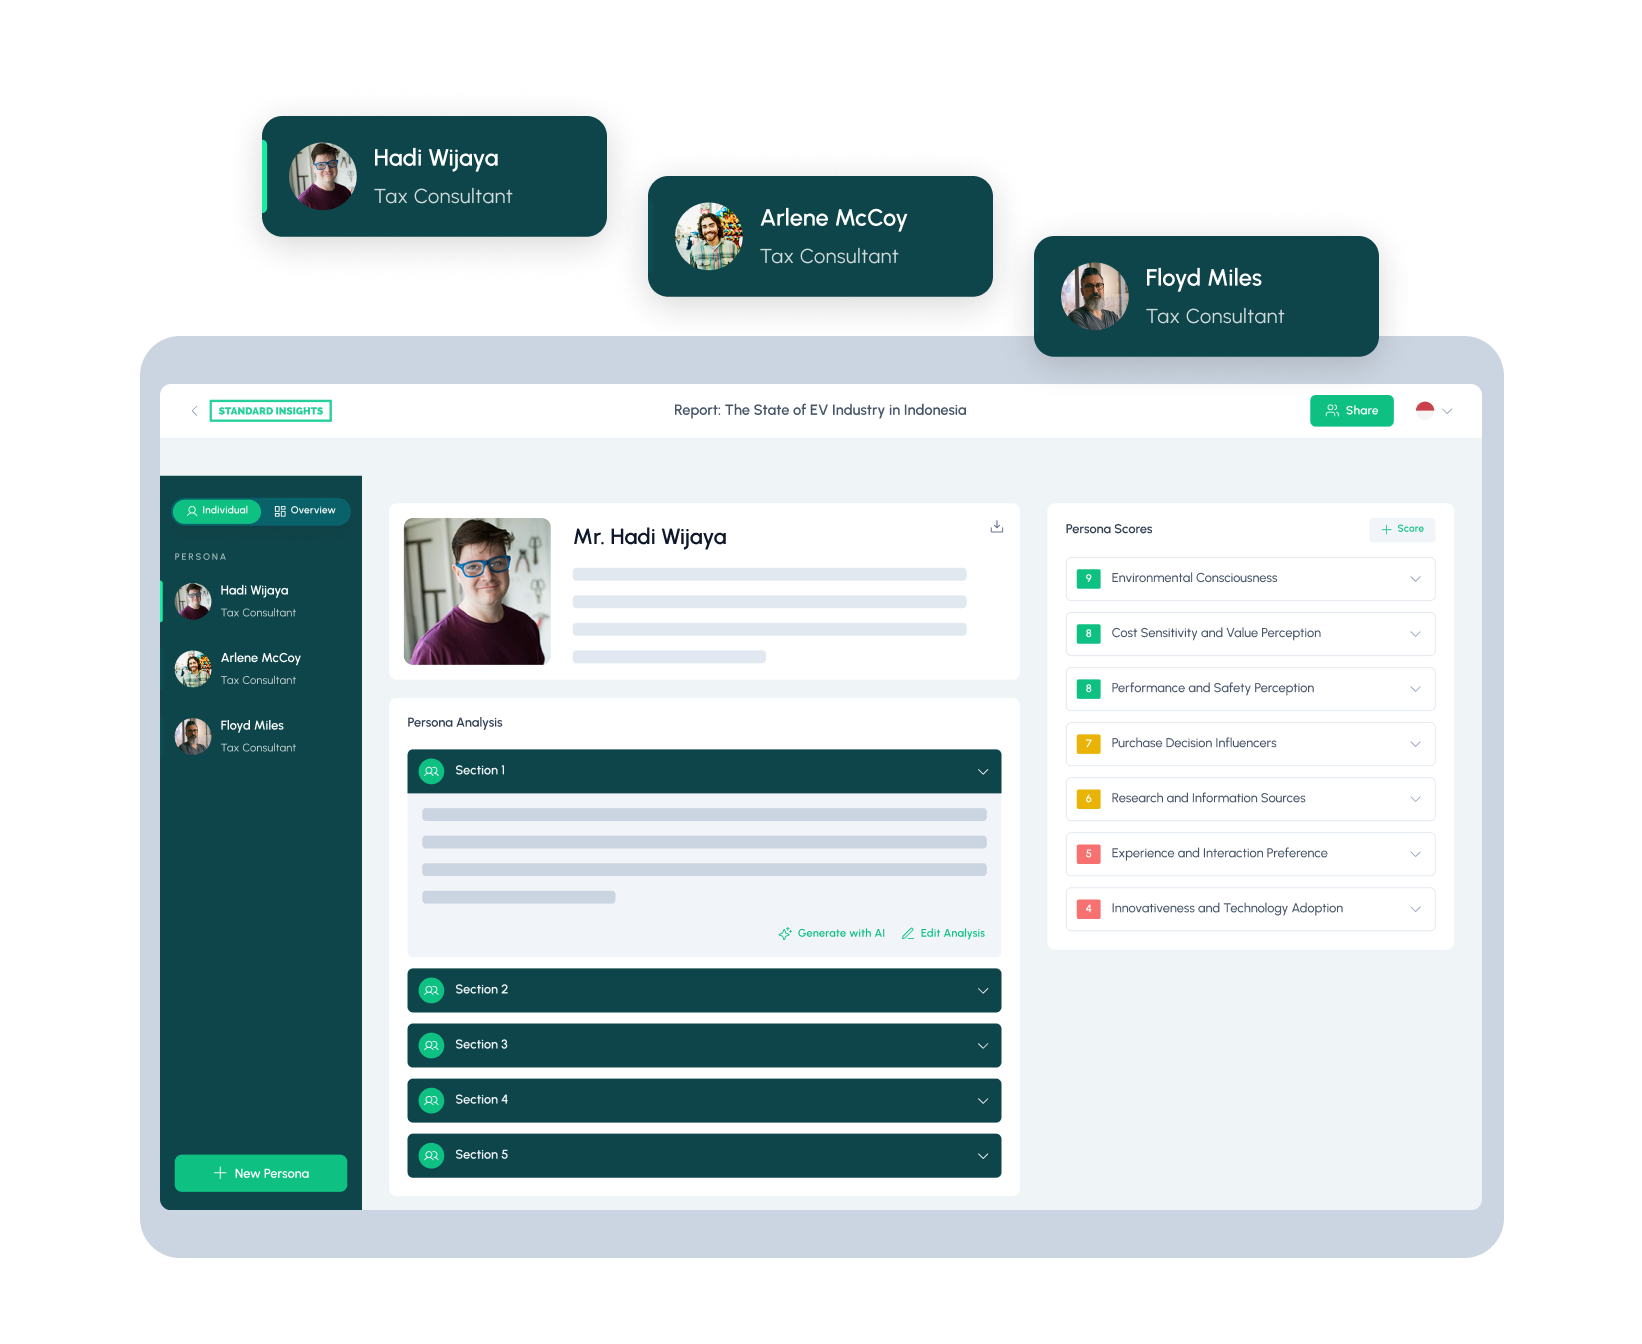
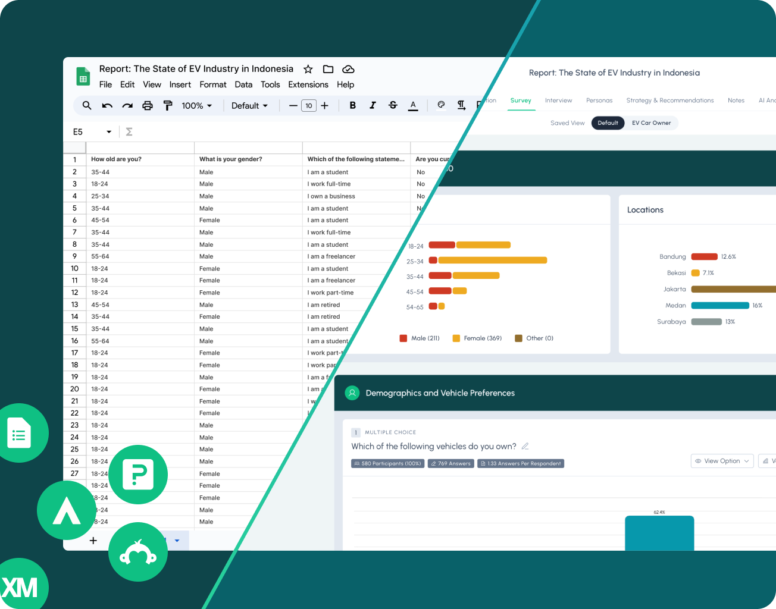
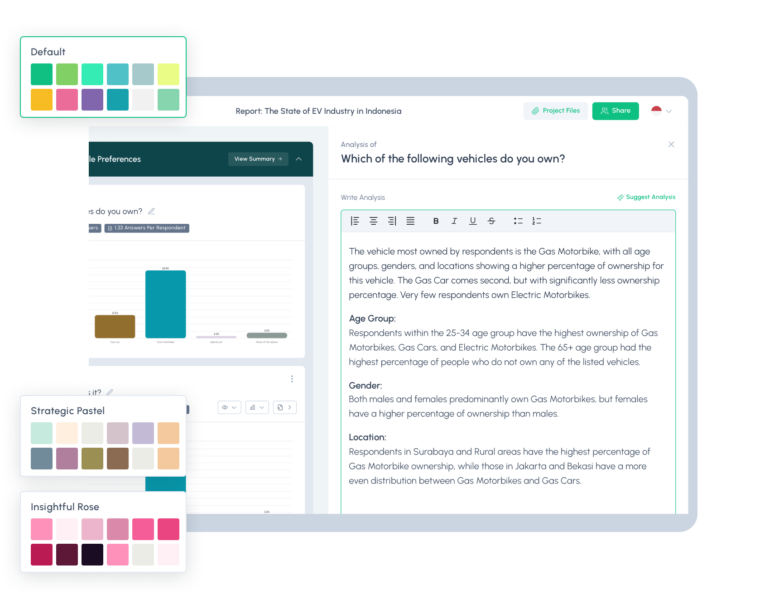
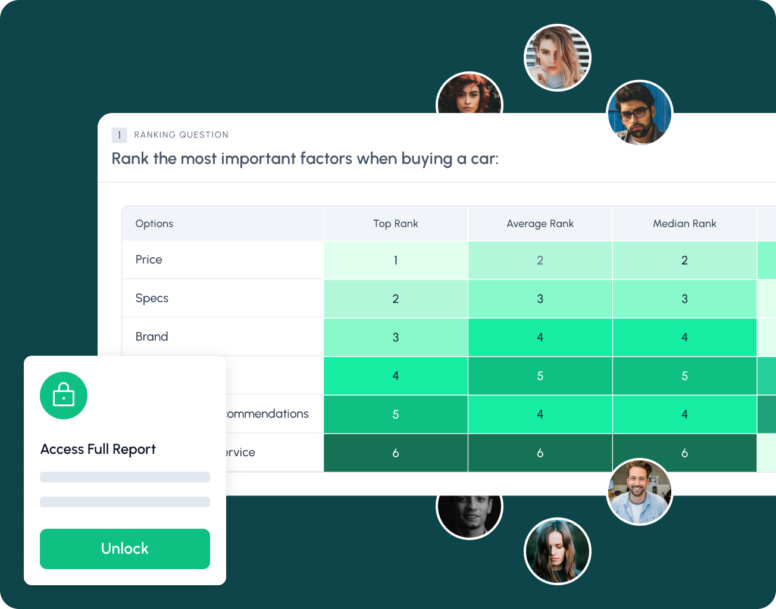
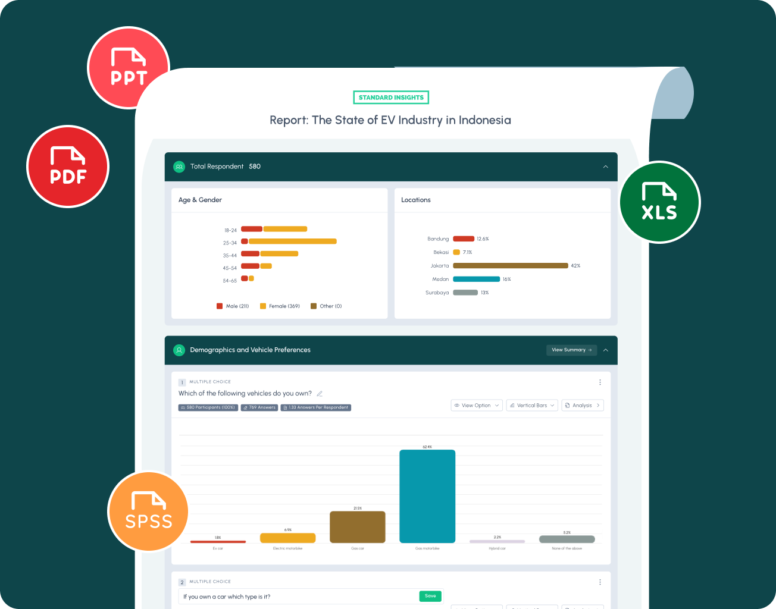
We developed our platform’s reports because we couldn’t afford to lose time and efficiency with outdated methods. With a focus on flexibility, our reports visualize your data, making it interactive for analysis and customizable to any brand. Transform your data into engaging narratives with ease and efficiency.
Easily create engaging market research reports that include various sources.
Data visualization doesn’t need to be hard. Upload your XLS file and instantly transform your survey data into a visualized report.
Every brand has standards, and your reports should reflect that. Our platform visualizes your research data while allowing you to infuse your brand style and voice.
Gone are the days of endless revisions; let your team access, comment, and explore data in their own way. Plus, easily publish reports online for external stakeholders to view and engage with your findings.
Not everybody wants to read a 200-page PowerPoint presentation. Export the report format that is most suited to your audience.
Discover our other services to get started with your research.
Build professional surveys easily and gather respondents from 150+ countries.
Learn more
Turn your survey results into visual data in minutes.
Learn more
Reduce analysis time and uncover valuable insights quickly with our suite of tools.
Learn more
Create your free account and use our set of tools to build your first report and conduct your research easily.