
Before you plan,
know how the category works.
A Usage & Attitudes study shows how people buy, why they stay, what makes them switch — and where the category is leaving something on the table.
Usually ordered when: entering a category, repositioning inside one, or building a plan that has to survive the question "how do you know that?" Usage & Attitudes gives you the answer to that question.
Usage & Attitudes on one screen.
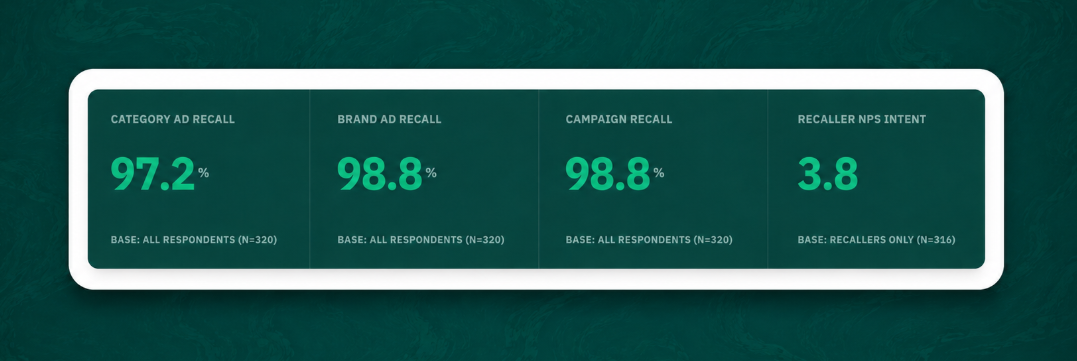
Who uses the category, how often, which brand they prefer, and the single thing they most want fixed. Four figures at the top, and five sections underneath explaining how the category got there.
Where you stand
Your position on the funnel against every competitor in the set - aware, tried, using, preferred - measured in the same wave, from the same people.
What's holding people
Why they stay with whoever they've got, and what would have to be true for them to move. Switching costs are usually smaller than incumbents believe.
Where the opening is
What the category isn't serving, in consumers' own words, before anyone offered them options. The analyst notes name the opportunity rather than leaving you to find it.
No go/no-go here. Usage & Attitudes doesn't produce a verdict — it produces a position, a set of constraints, and somewhere to attack.
Three reads, and the reasoning behind them.
Enough to build a plan on without opening anything else — and if someone wants to dig, the full Usage & Attitudes report is underneath.
Category reality.
- Verified demographic breakdown
- Purchase frequency & channel mapping
- Usage occasions, drivers & barriers
Competitive dynamics.
- Full brand funnel leakage analysis
- Ranked choice drivers & relationship types
- Unprompted brand associations
Strategic openings.
- Claimed vs actual purchase criteria gap
- Switching barriers & desired features
- Demand-side brief & analyst bottom line
01 - The behaviour
Demographics, channels & occasions.
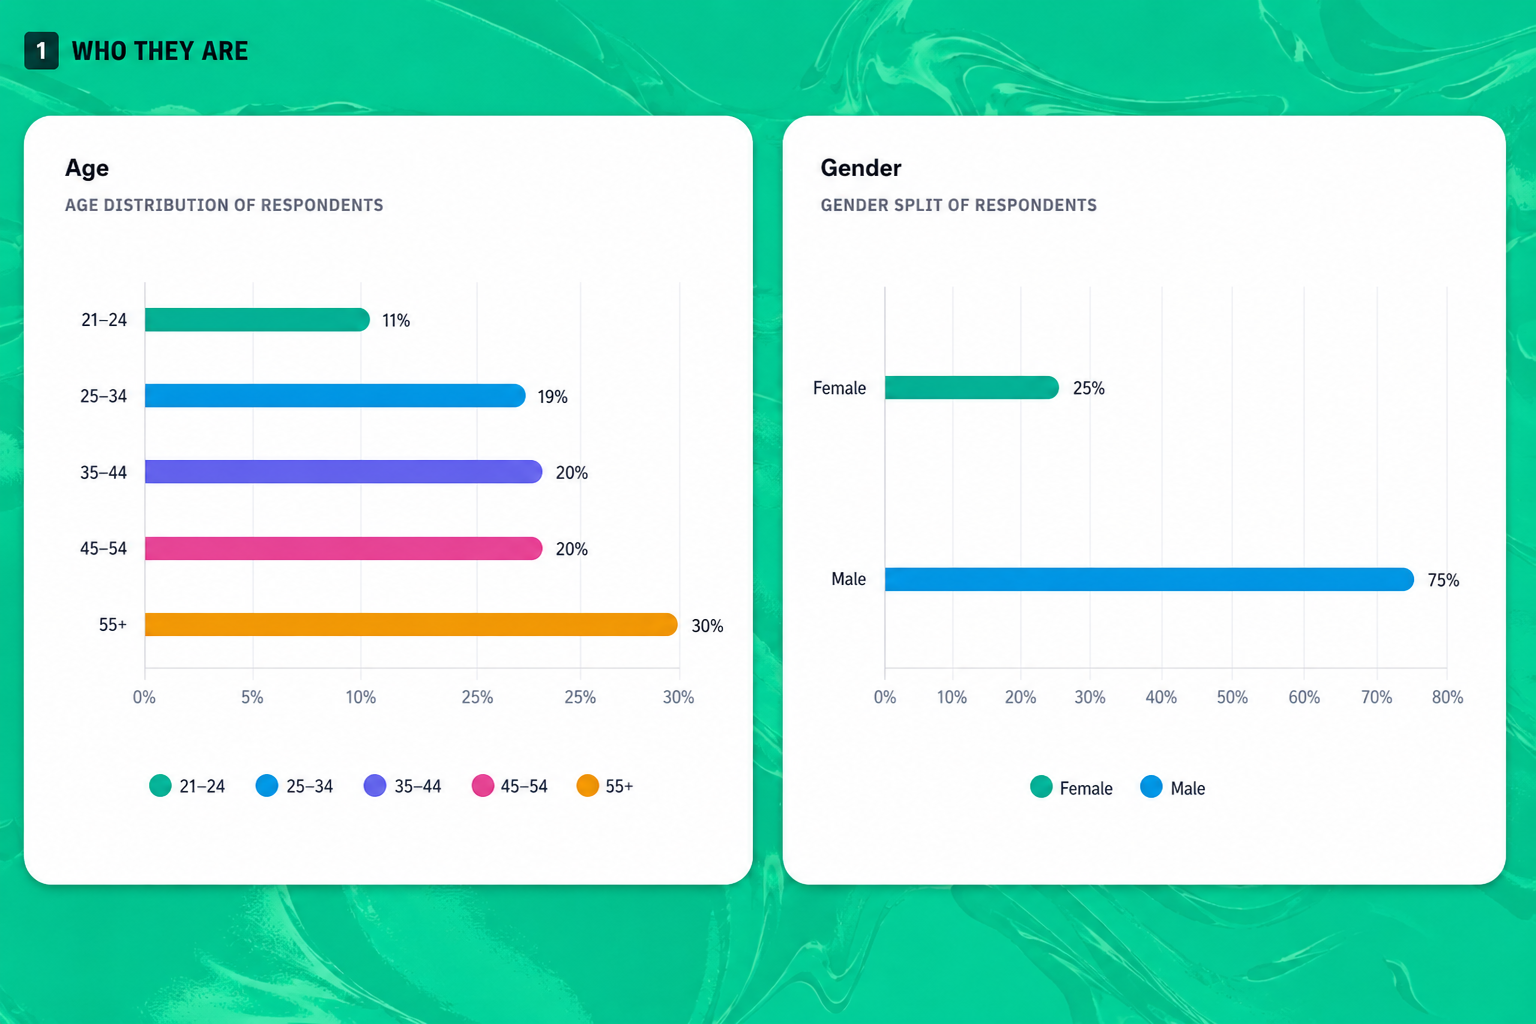
Who they are - age, gender, income and employment across everyone who qualified into the category. The demographic reality, not the target you wrote down. How often, and where they buy - frequency and channel, so a digital-first plan meets the fact that most of the category still moves through supermarkets. Usage occasions - when and why people actually use it. Relaxing at home and watching sport are different targeting angles from the same finding. Drivers and barriers side by side - what makes people use the category, and what's stopping them using it more. The barriers list is where most of the growth is hiding.
02 - The landscape
Brand funnel & choice drivers.
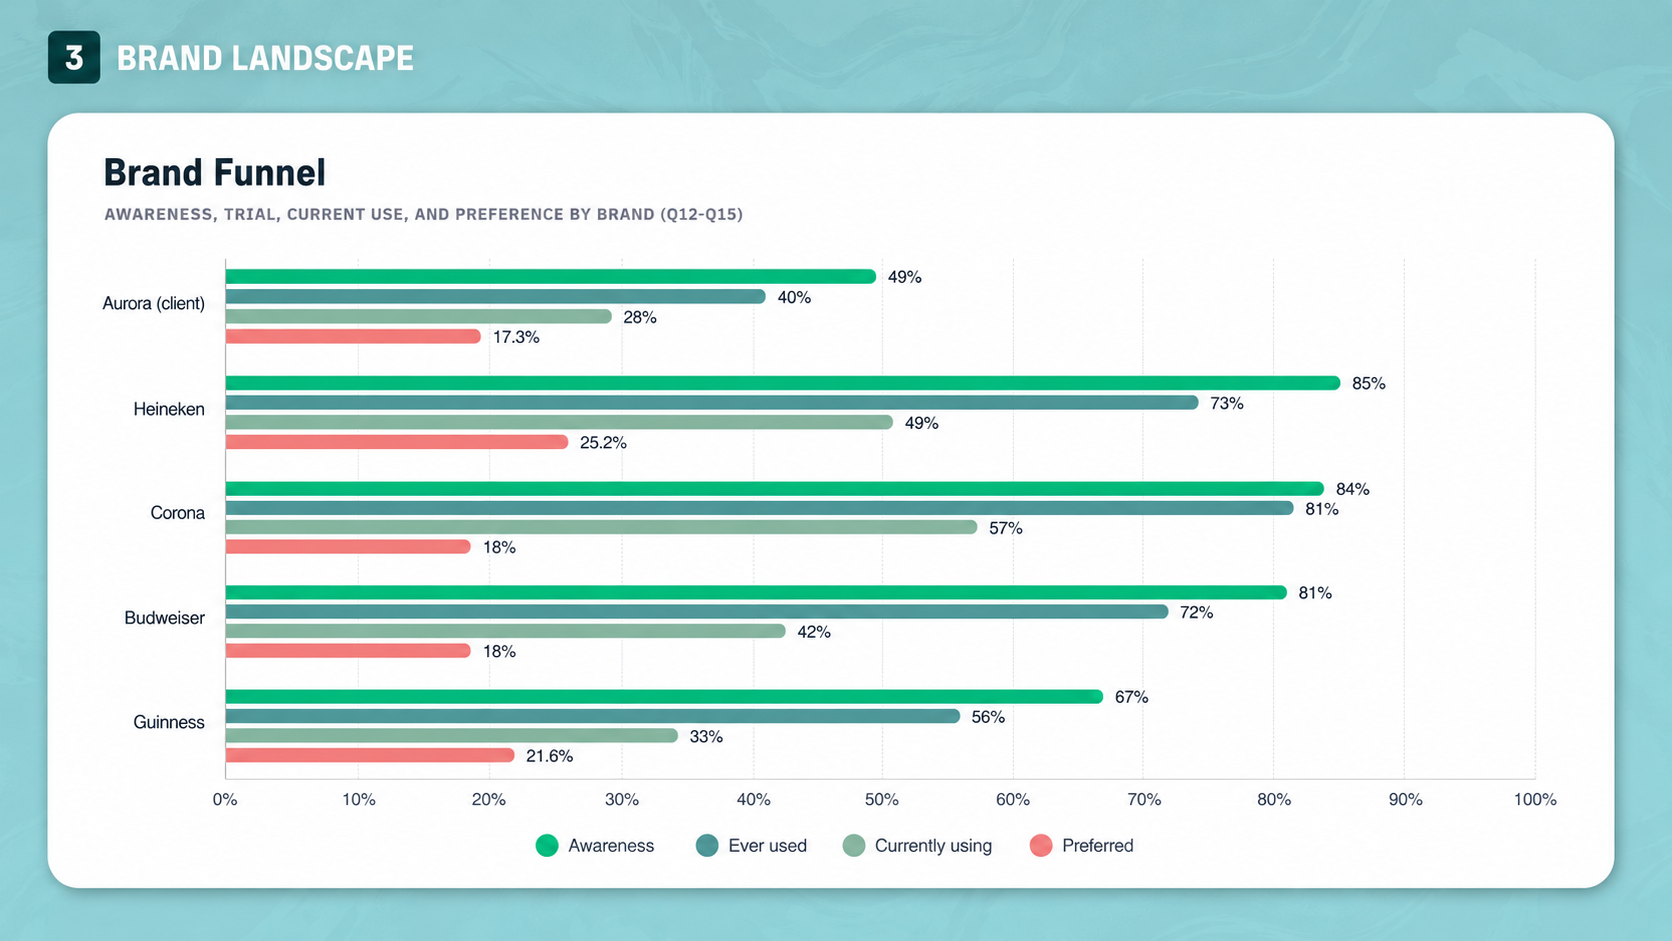
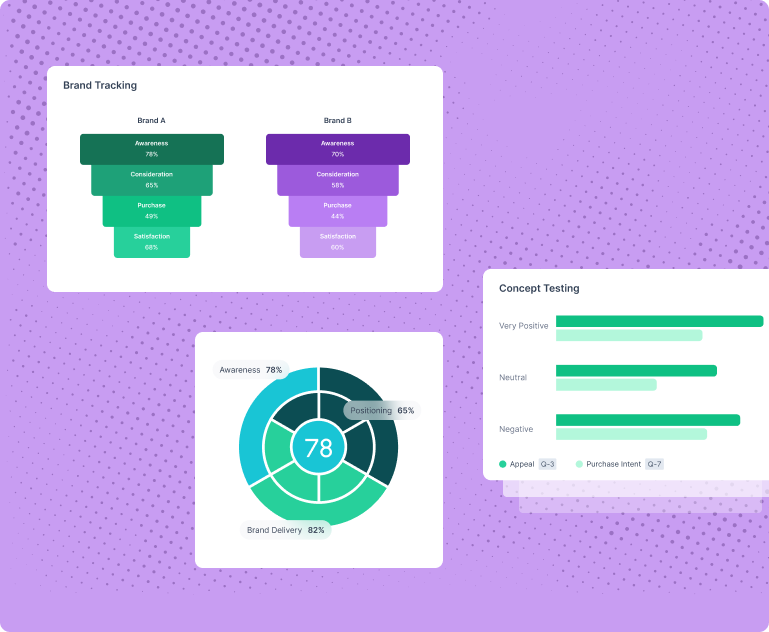
A full brand funnel - awareness, ever used, currently using and preferred, for you and every competitor, on one chart. Where you leak against where they leak. Choice drivers - what people say decides the brand, ranked. Quality, price, availability, reputation, trust. Relationship type - loyal, rotating, just started, or lapsed. A category can look loyal on share and be entirely promiscuous underneath. Brand associations - the attributes attached to you, among people who've heard of you. What you're understood to be, rather than what you say.
03 - Gaps & bottom line
Unmet needs & strategic opening.
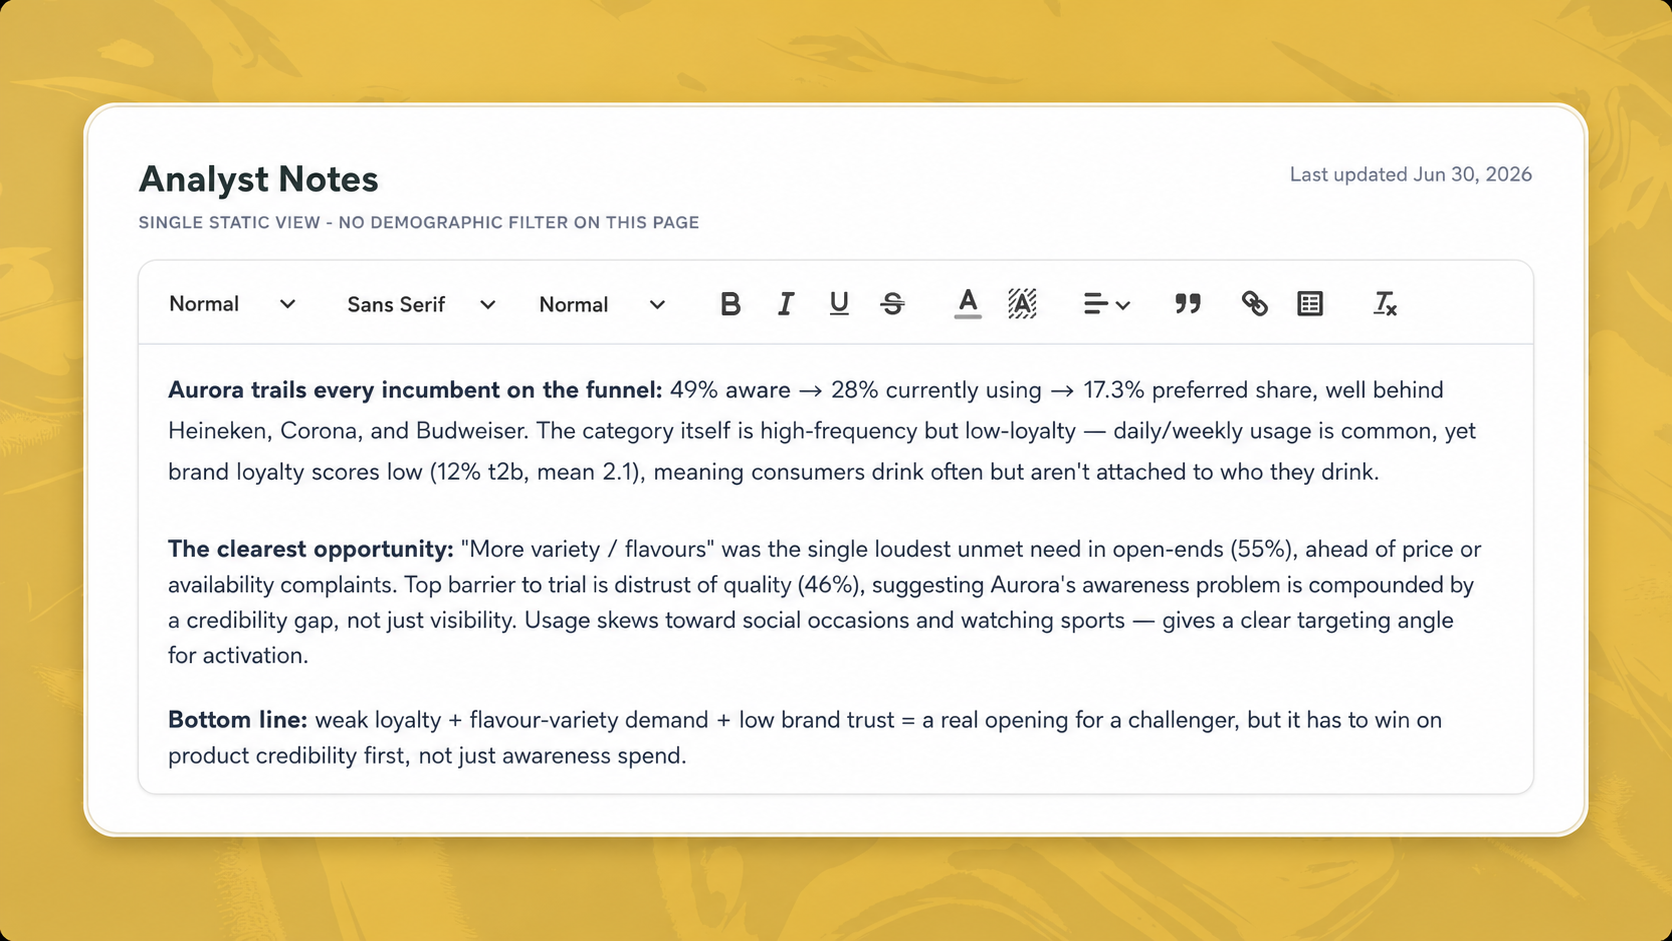
Attitudes and purchase criteria - what people claim matters, next to what they actually do. The gap between the two is usually the interesting part. Switching barriers and new-brand expectations - exactly what a challenger has to clear, and what people say they'd need to see. Areas to improve and desired features, clustered from open-text answers. Nobody was given a list; these are the words people volunteered. Growth triggers - what would make the category get used more, ranked. This is the demand-side brief. Analyst notes with a stated bottom line. Not a summary of the charts - a read of what they mean together, ending on where the opening is and what has to be won first.
Full Report Underneath
And the full report, if the answer raises another question.
Behind the dashboard sits the complete report - segment cross-tabs, personas, verbatim responses, market context, and every question exactly as it was answered. A U&A generates more depth than any other Standard Study, and most of it lives here.
See what's in a full report →Usage & Attitudes in three steps.
You define the category and who counts as a user. We map the whole journey across 26 questions and hand back the landscape.
In just a few minutes.
- Define the category and qualifying behaviour - used or bought within a timeframe you set
- Name your brand and competitors, or let us build the set from the category
- Add your own attitude statements alongside the standard set, if there's something specific you need tested
- Add markets. Several can run inside one study, kept comparable
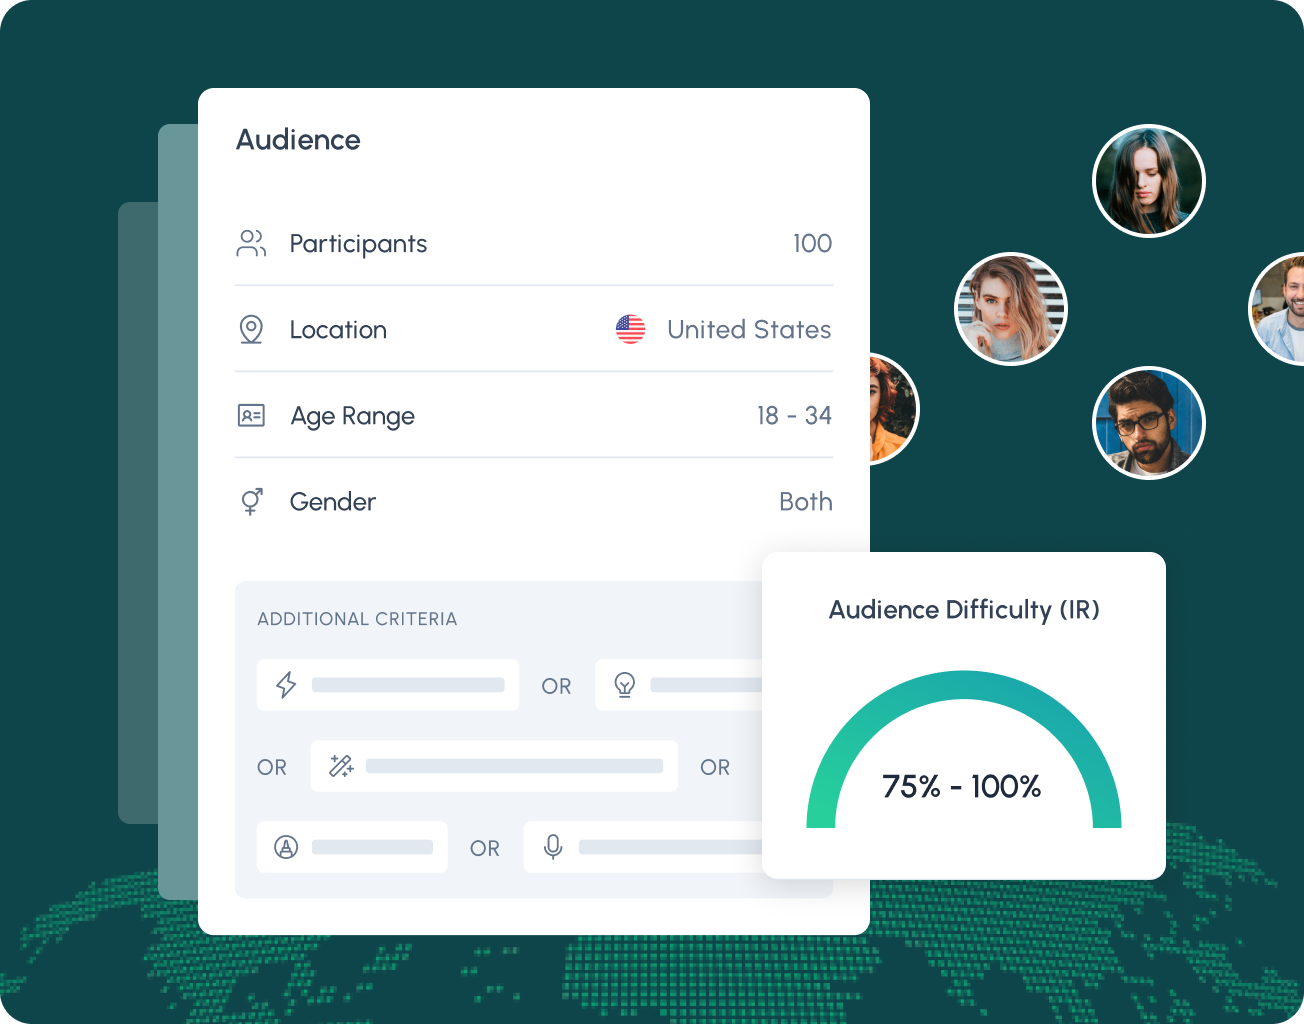
- You set it up yourself, in your own workspace - audience, criteria, add-ons - with the price updating as you go. No quote to wait for, no procurement step.


Why the answer holds up.
Category understanding usually arrives secondhand - a market report written for everyone, a distributor's view, or your own sales data, which by definition only describes people who already chose you. Usage & Attitudes asks the whole category instead.
Who answers
- Category users only, screened in before they answer anything - including your competitors' customers, which is where most of the value sits
- 170M+ verified consumers across 130+ markets, from Kantar Profiles, Cint and Dynata
- Never synthetic. Every response comes from a verified human, not a model
- 300 per market minimum, so cross-market Usage & Attitudes comparisons and segment cuts both hold
How it's asked
- Every brand measured in the same wave, on the same questions, from the same people. Not your figures against someone else's published benchmark
- Open questions come before the prompts. What people would improve is captured in their words, then clustered - so the gaps come from consumers rather than from a list we wrote
- Geolocation, speed detection and consistency screening before anything reaches analysis
- You get the sample you ordered. Order 300, receive 300 clean responses - removals are on us
How it's read
- A person writes the bottom line. A landscape doesn't reduce to a threshold, so an analyst reads the whole picture and names the opening
- Including what has to be won first. If awareness isn't the real problem, the notes say what is
- Base sizes on every cut, and where a finding rests on a subgroup, that's stated
- One method across every market, so a difference between two countries is a real difference, not two studies run differently
Run it yourself, or have us run it.
Same 26 questions. Same screened category users. Same 24 hours.
Run it yourself
Define the category and the qualifying behaviour, name your competitive set, add markets. The price updates as you go, and you pay online.
Have us run it
Tell us the category and what you're planning against. We set the boundaries with you — the most consequential decision in a study like this — run it, and deliver the picture with an analyst to name where the opening is.
You're a good fit if
You're not a good fit if
Usage & Attitudes questions, answered.
What is a Usage & Attitudes study?
A Usage & Attitudes study maps how a category actually works: who uses it, how often, through which channels and on what occasions; the full brand funnel for you and every competitor measured in the same wave; what drives brand choice; what holds people with their current brand and what would make them switch; and what the category isn't serving, captured unprompted and clustered afterwards. 26 questions, 300 screened category users per market, 24 hours to 5 days, from $3,990.
How much does a Usage & Attitudes study cost?
From $3,990 per study, covering 300 screened category users, 26 questions, your competitive set and analyst notes with a stated bottom line. Several markets can run inside one study, priced and sized per market. Categories with an incidence rate under 30% need a custom quote.
How is this different from Who Are You Talking To?
That one profiles a group of people - who they are, what they value, where you sit with them. This maps a category - how purchases happen, what drives loyalty, what triggers switching, and where the unmet needs sit. One tells you who to talk to. This tells you what you're competing inside. Entering a new market, many accounts run both.
This includes a brand funnel. How is that different from a brand health study?
Here the funnel is one section of a category map — the point is understanding how the category works, and your position is context for it. A brand health study is built entirely around your brand: full funnel, perception attributes, advertising and touchpoints, buyer profile, against your named competitors, from $3,990. Entering a category, plenty of accounts run this first and measure their brand afterwards.
Do I get a verdict like the other Standard Studies?
No, and that's deliberate. A concept test can say deploy or don't; a category map can't. What you get instead is a position, a set of constraints, and a stated bottom line from the analyst on where the opening is and what has to be won first.
Can you run the study for us?
Yes. Tell us the category and what you're planning against — we set the category boundaries with you, run the study and deliver the picture, with an analyst to name where the opening is and what has to be won first. Same study, same 24 hours.
Does it cover people who don't buy from me?
Mostly, and deliberately. Everyone who uses the category qualifies, whichever brand they currently choose. Your own customers can only tell you why they stayed - everyone else can tell you why they didn't come.
Where do the "areas to improve" come from?
Open-text answers, clustered after the fact. Nobody was shown a list of complaints and asked to pick. That's why "nothing to improve" shows up as an option in the results - because some people said it.
Can I cover more than one market?
Yes, in a single Usage & Attitudes study, with the same questions and the same method throughout. That's what makes cross-market comparison meaningful - two separately commissioned studies rarely produce numbers you can put side by side.
Who defines the category?
You do. Category boundaries are one of the most consequential decisions in a study like this, and they're yours to set. If you'd rather talk it through first, we will.
Can I add my own questions?
You can add your own attitude statements alongside the standard set. If you need substantially more than that, Your Questions, Our Audience gives you full control of the questionnaire with the same audience and the same report.
How many respondents?
300 minimum per market. Below that, the segment and brand-level cuts stop being reliable.
Need the audience, not the category? See Who Are You Talking To? →
Ready to launch.
The fastest way to an answer.
Whatever you're deciding, there's a study designed for it.
Test concepts, messages, and creative before you commit budget.
See Concept Testing →Test the finished creative against a control group, before the media spend.
See Brand Lift →Measure what your campaign actually changed.
See Campaign Recall →Measure your funnel, perception and position against your competitors.
See Brand Health →Build real audience segments from real consumer data.
See Audience Profiling →See how your category behaves before you plan.
You're here - Usage & AttitudesKnow the category before you plan against it.
Define your category and your consumer — the picture is back in 24 hours. Usage & Attitudes runs from $3,990.