
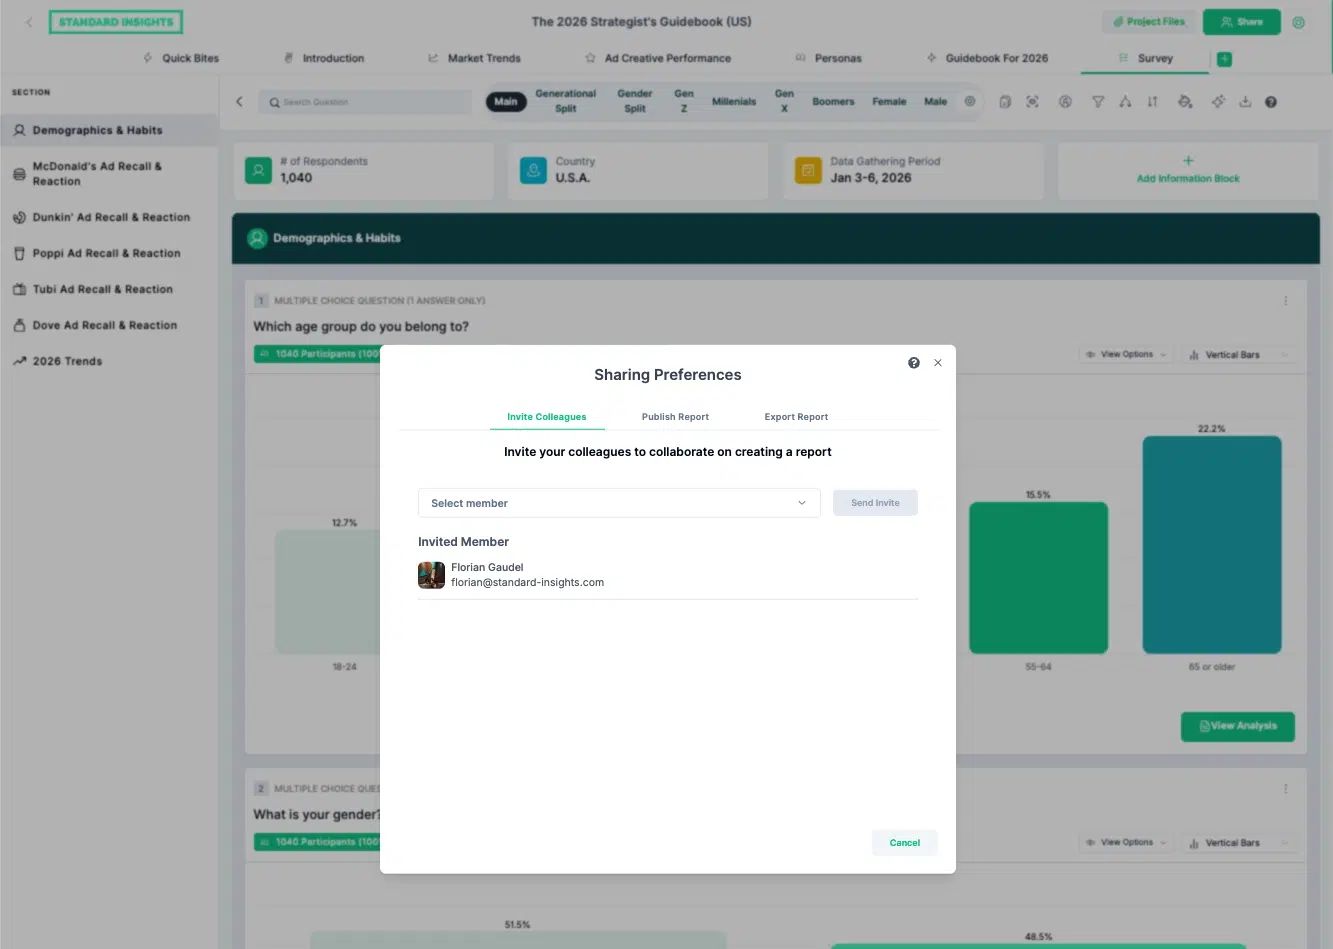
Invite Colleagues
If someone in your workspace needs full access to the report, all tabs, persona chat, and downloadable assets, invite them directly from the Invite Colleagues tab. They get their own login and can explore everything without any restrictions on functionality.
No link management, no gate settings, and no decisions to make.
Publish Report
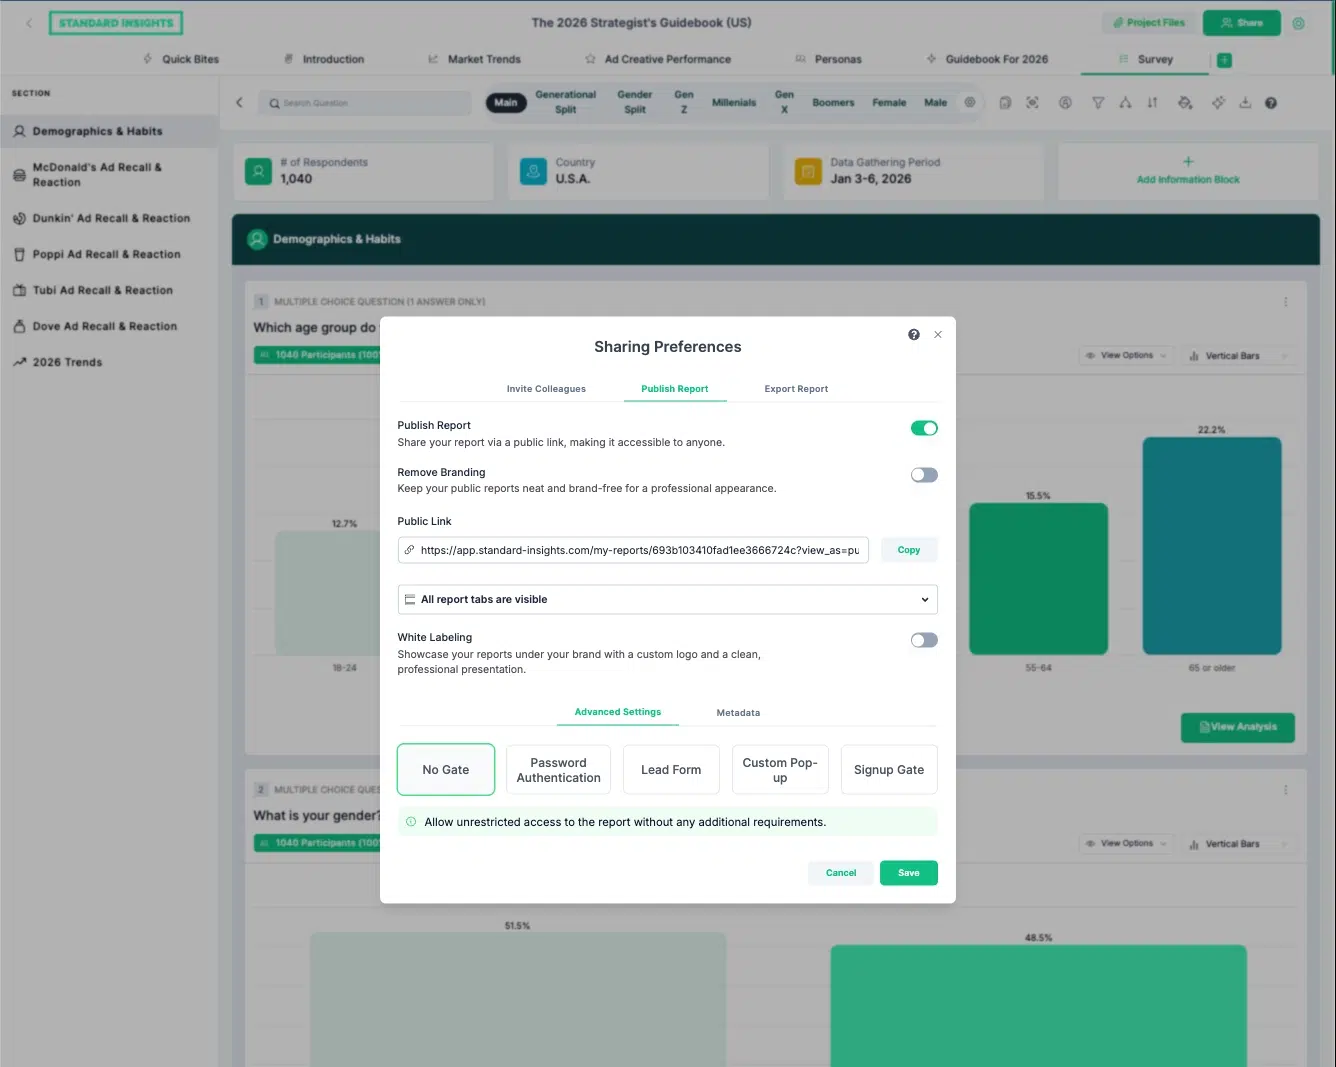
Publish Report generates a shareable link for anyone without a platform account. Before you generate it, choose the right gate type. The four options have meaningfully different implications, and the choice is easy to make carelessly.
No Gate — unrestricted access to anyone with the link. Use it for public-facing content or audiences where any friction would reduce engagement.
Password Authentication — the viewer needs a code to enter. Use it when sharing with a specific external group where you want light access control without collecting their details.
Lead Form — the viewer submits their information before accessing. Use it when the report is functioning as a lead generation asset.
Custom Pop-up — a fully configurable entry screen. Use it when the standard options do not fit the use case or when a white-labeled client presentation requires a specific entry experience.
Beyond the gate, three additional settings are worth knowing before you publish. Tab visibility lets you show or hide any combination of report sections, which is useful when sharing a subset of findings rather than the full report. Metadata controls the image, title, and description that appear when the link is previewed in email or on social. White labeling removes Standard Insights branding entirely for client-facing presentations where the report needs to appear as your own work product.
Export Report
Five formats, all generated from the actual report data and all delivered without manual reformatting or design work, each one ready to use in a different context.
The right format depends on who the audience is and how they will consume the findings.
| Format | Best for | Notes |
|---|---|---|
| Presentation (PPT or PDF) | Board meetings, client presentations, pitches | Fully editable in PowerPoint. Every chart is a native element, not a static image. Choose which tabs and questions to include. |
| Social Carousel | LinkedIn distribution of findings | LinkedIn-format carousel images, ready to post without design work. |
| Infographic | Quick external sharing, embedding in articles or emails | Single summary image covering key findings. |
| Narrative Article | Thought leadership publication, blog posts, briefing documents | Written article structured for SEO and GEO compatibility. Ready to publish. |
| Video Brief | Executive or stakeholder audiences who will not read a deck | 30-second introduction video presenting the key findings. |
The Presentation format deserves a specific note. Most research tools export charts as static images, a locked screenshot that cannot be edited without going back to the source. The Standard Insights PowerPoint export produces native chart elements: fully editable in PowerPoint, resizable, recolorable, and adjustable without touching the original report. For anyone who builds decks from research outputs regularly, that means the exported file works as a first draft, not a starting-over point.
Export history is saved in the Export Report tab. Previous exports can be re-downloaded without regenerating. If you shared a presentation two weeks ago and need it again, it is there without a new export run.

For readers who want to go deeper on filtering and segmentation before exporting, the Survey Tab Walkthrough covers every toolbar function. How to organize and archive reports across studies will be covered in the Project Files article.