

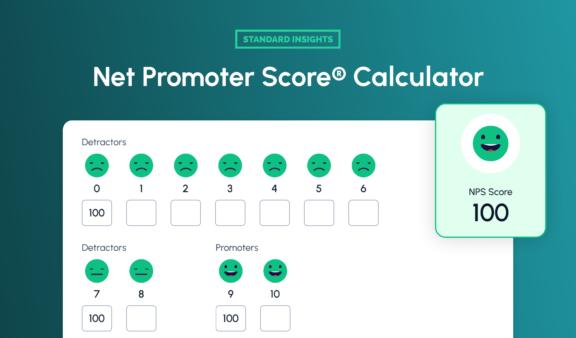
Calculate your Net Promoter Score instantly with our free NPS calculator. Measure customer loyalty, interpret results, and boost satisfaction.

Enter the number of people in your target population (N). If unknown or very large, leave “Unknown” checked. We’ll apply the finite population correction automatically when n is a large share of N.

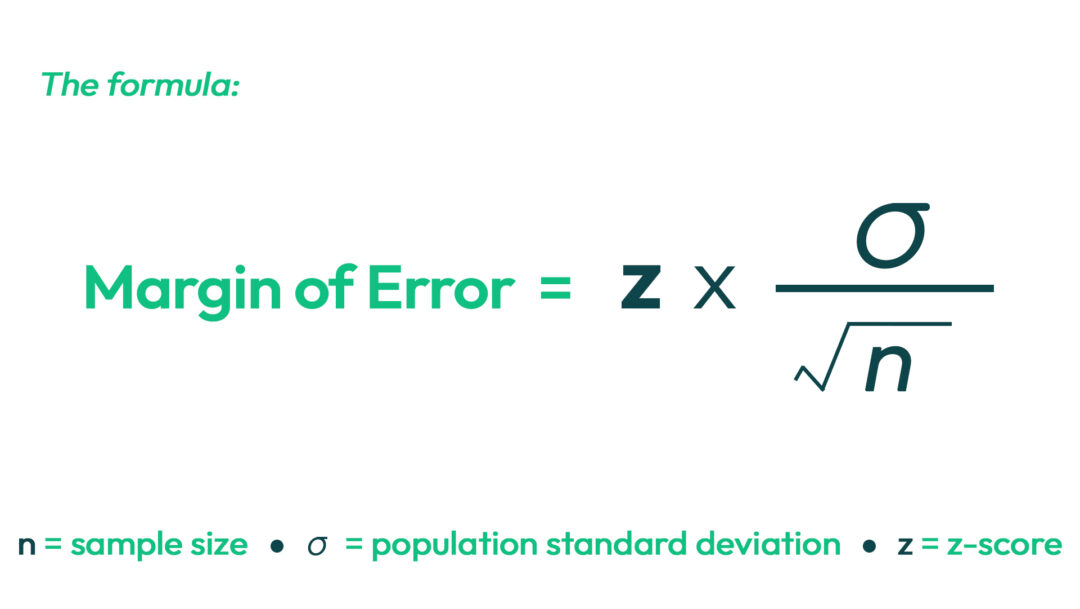
Enter how many completed responses you have (n). Bigger n reduces the margin of error, but with diminishing returns, about 4× the sample to halve MOE.

Choose your confidence level. 95% is standard (z = 1.96). Use 90% (z = 1.645) for exploratory work or 99% (z = 2.58) for maximum rigor.
Calculate your Net Promoter Score instantly with our free NPS calculator. Measure customer loyalty, interpret results, and boost satisfaction.
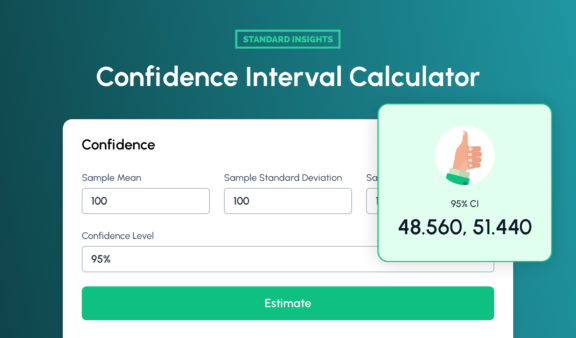
Use our Confidence Interval Calculator for quick, reliable estimates from your sample data. Ideal for data-driven decisions in research and analysis.
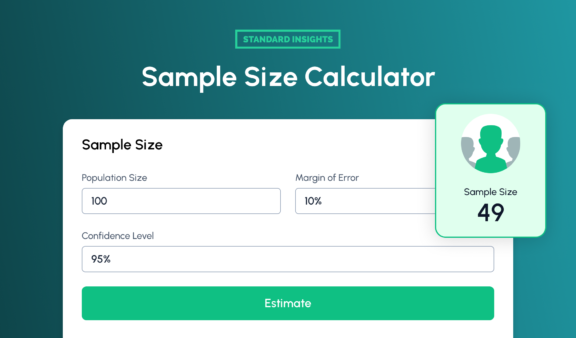
Quickly calculate the ideal sample size for your study based on confidence level, margin of error, and population size.
