
Enterprise users only. This workflow is for Enterprise users who selected Bring Your Own Audience in the Target Audience tab. If you are using National Representative or Custom Audience, your order continues through the standard paid funnel. See How to Place an Order and What Happens After You Place an Order instead.
If you have not built your survey yet, start with How to Create a DIY Survey.
Share Tab — Distributing the Survey
Once the survey is ready, click the Share tab, step 2 in the three-tab interface.
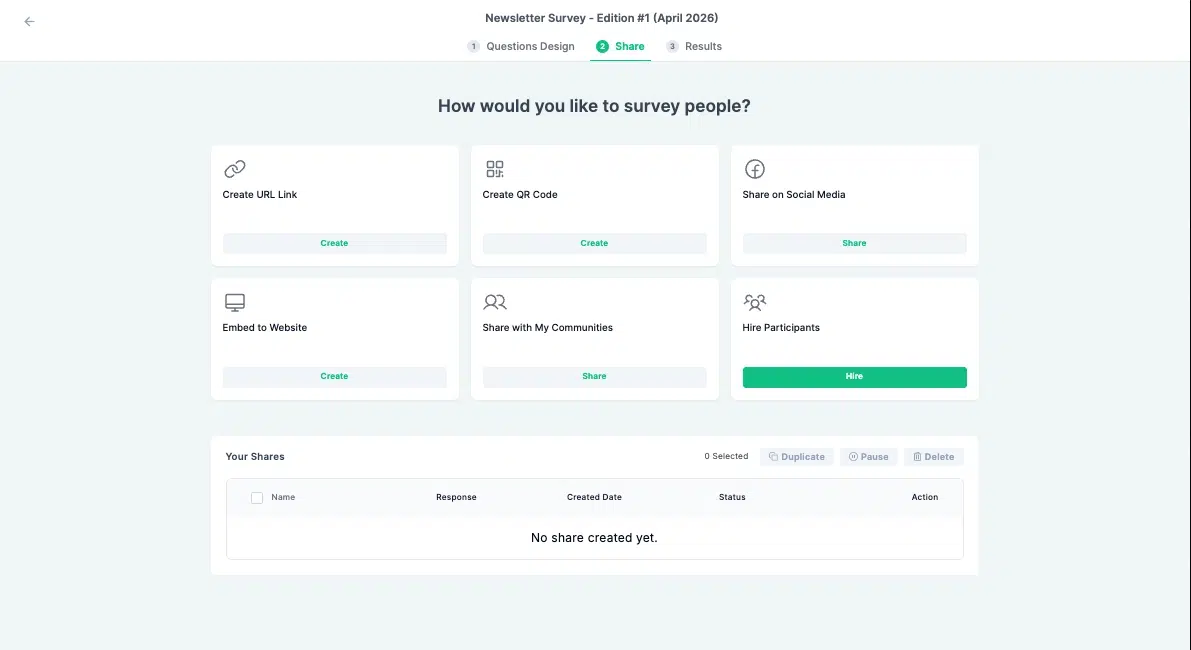
Six distribution options are available on this screen:
- Create URL Link — generates a shareable link
- Create QR Code — generates a QR code
- Share on Social Media — direct sharing to social channels
- Embed to Website — generates embed code for a website
- Share with My Communities — sends the survey to a respondent list managed directly in the platform. My Communities is the in-platform CRM where you can manage your own respondent lists
- Hire Participants — accesses the paid respondent panel
All active shares are listed in the Your Shares table below the distribution options, showing name, response count, created date, and status such as Active or Paused. Each share can be edited, duplicated, paused, or deleted from this table.
Results Tab — Reviewing Responses
As responses come in from your own audience, click the Results tab, step 3, to review them.
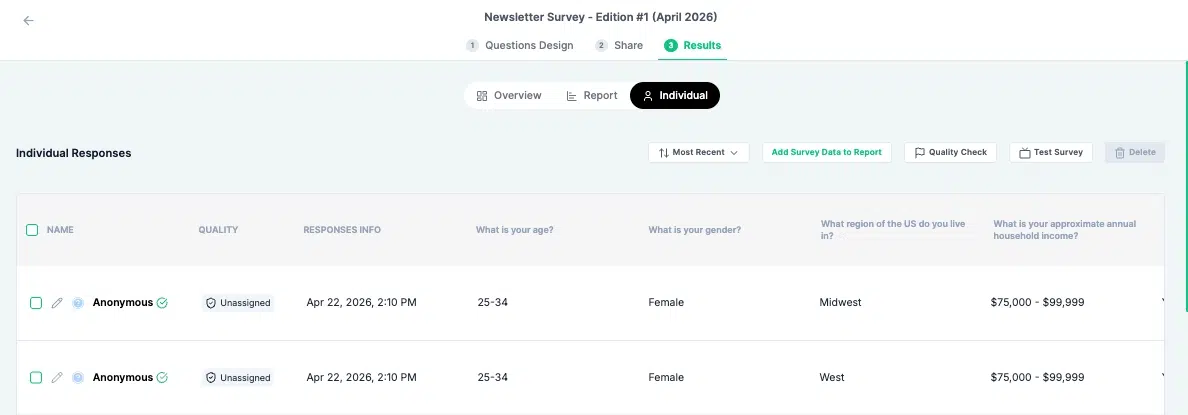
Three sub-tabs are available: Overview, Report, and Individual.
Overview
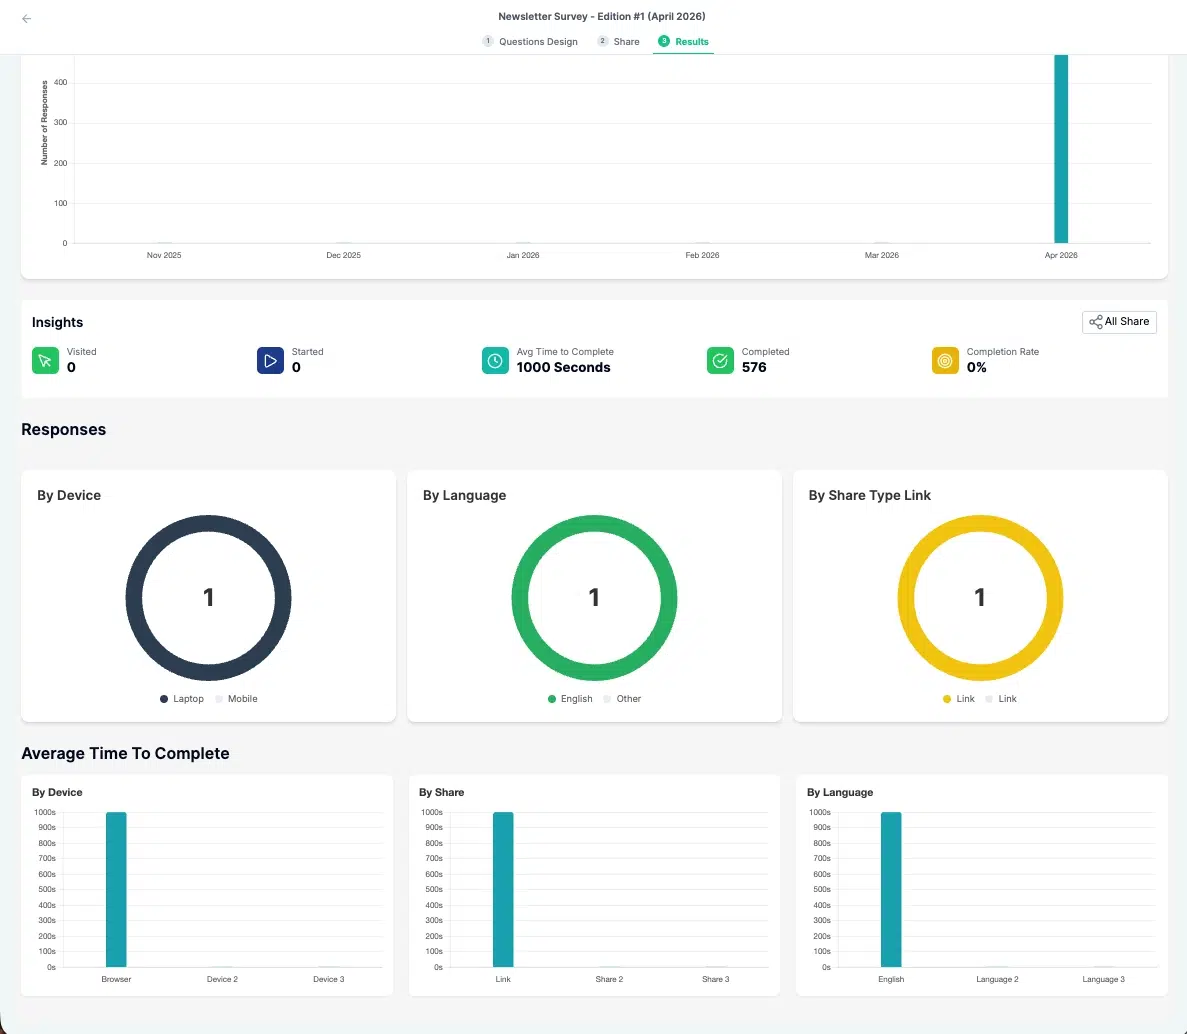
Overview is a high-level dashboard showing response activity and engagement metrics across the full survey. Key figures shown at the top include Visited, Started, Avg Time to Complete, Completed, and Completion Rate.
Below that, the Responses section breaks down responses by Device, Language, and Share Type Link. The Average Time to Complete section shows the same breakdown by device, share, and language. A response volume chart at the top shows how responses have come in over time, which is useful for tracking collection progress across a fielding period.
Report
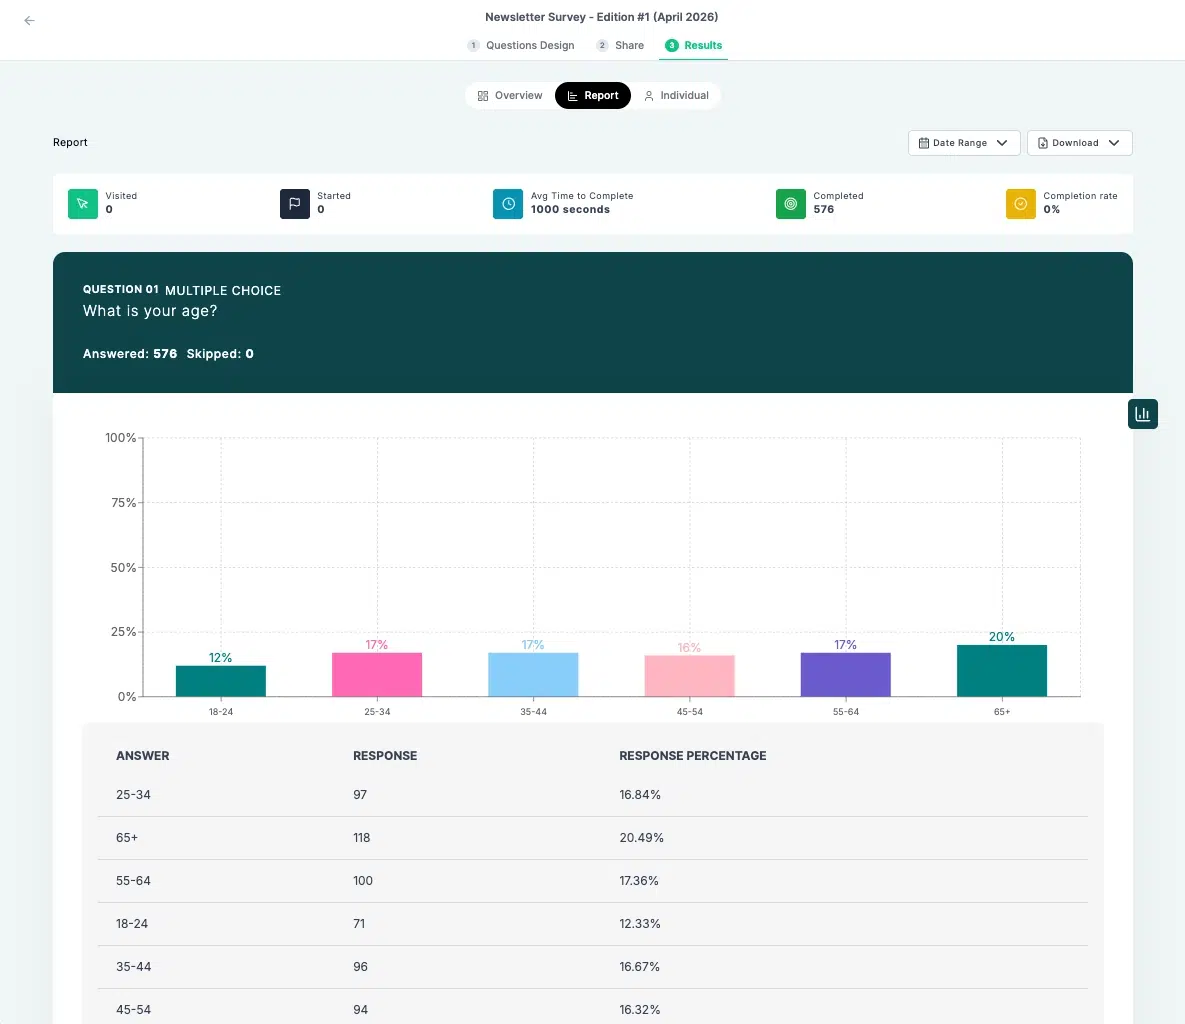
Report is a question-by-question view of the results. Each question is rendered as a chart with an accompanying data table showing answer options, raw response counts, and response percentages.
A Date Range filter at the top right lets you narrow results to a specific collection period. A Download button allows you to export the report view directly. This sub-tab gives you a clean summary of findings before pushing data into a full report.
Individual
The Individual view shows one row per respondent with their answers across all questions, sortable by most recent. Each row displays a Quality status badge. Before a quality check is run, all badges show as Unassigned.
Toolbar options in this view include Add Survey Data to Report, Quality Check, Test Survey, and Delete.
After quality control runs, each response is categorised as Valid, Suspicious, or Invalid. You can manually review and approve or remove flagged responses before the data is used.
Quality Control
Click Quality Check to open the Quality Control panel. Three methods are available and can be combined:
- Based on Time Limit — flags any respondent who completed the survey below a minimum time threshold as invalid. A very fast completion typically indicates the respondent was not reading the questions.
- Based on the Answer — define which question-and-answer combinations are impossible or contradictory. Responses matching those rules are flagged.
- AI Quality Check — the AI scans all responses automatically for suspicious patterns.
After running the check, you can manually review and approve or remove any flagged response before the data is used.
Pushing Data to a Report
Once the data is clean, click Add Survey Data to Report.
A panel opens showing your existing reports to choose from, or the option to Create New Report. Selecting a report pushes the survey data into the Survey page of that report, where it can be visualised, filtered, and analysed.
For a full description of what the Survey page and other report page types can do, see Report Page Types — What Each One Does.