Start Visualizing Your Survey Data Now
Easily collect, analyze, and report data with just a few clicks.
Upload your XLS file, visualize data, generate analysis, and share reports—all in a few clicks.
Compatible with your favorite survey builders
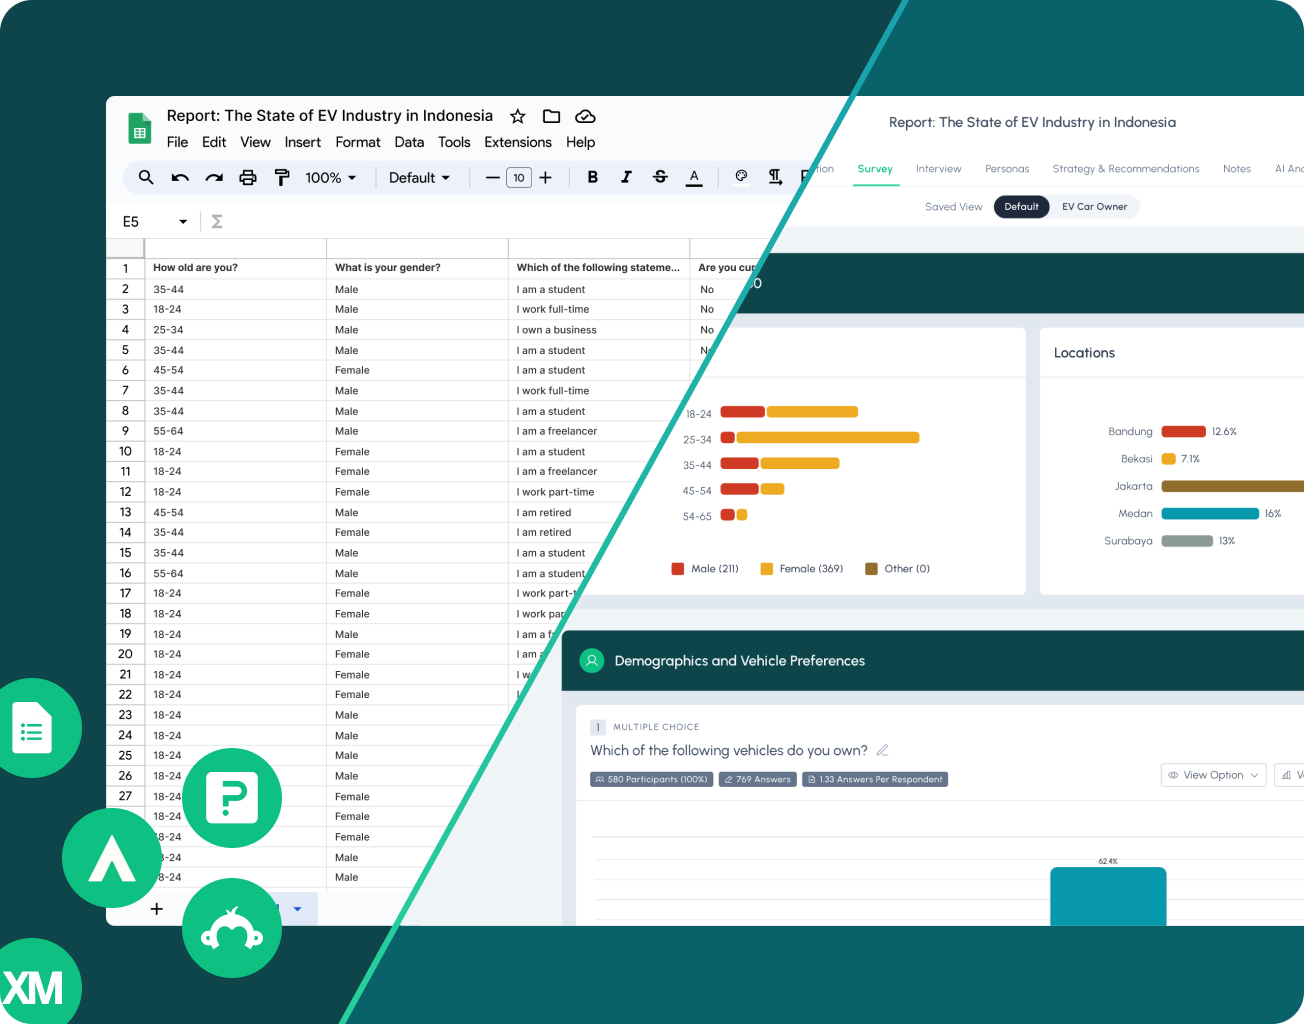
Log in or create your free Standard Insights account, then upload your survey data with ease to get started
Double-check that our system has accurately detected and matched all your question types and adapt if necessary.
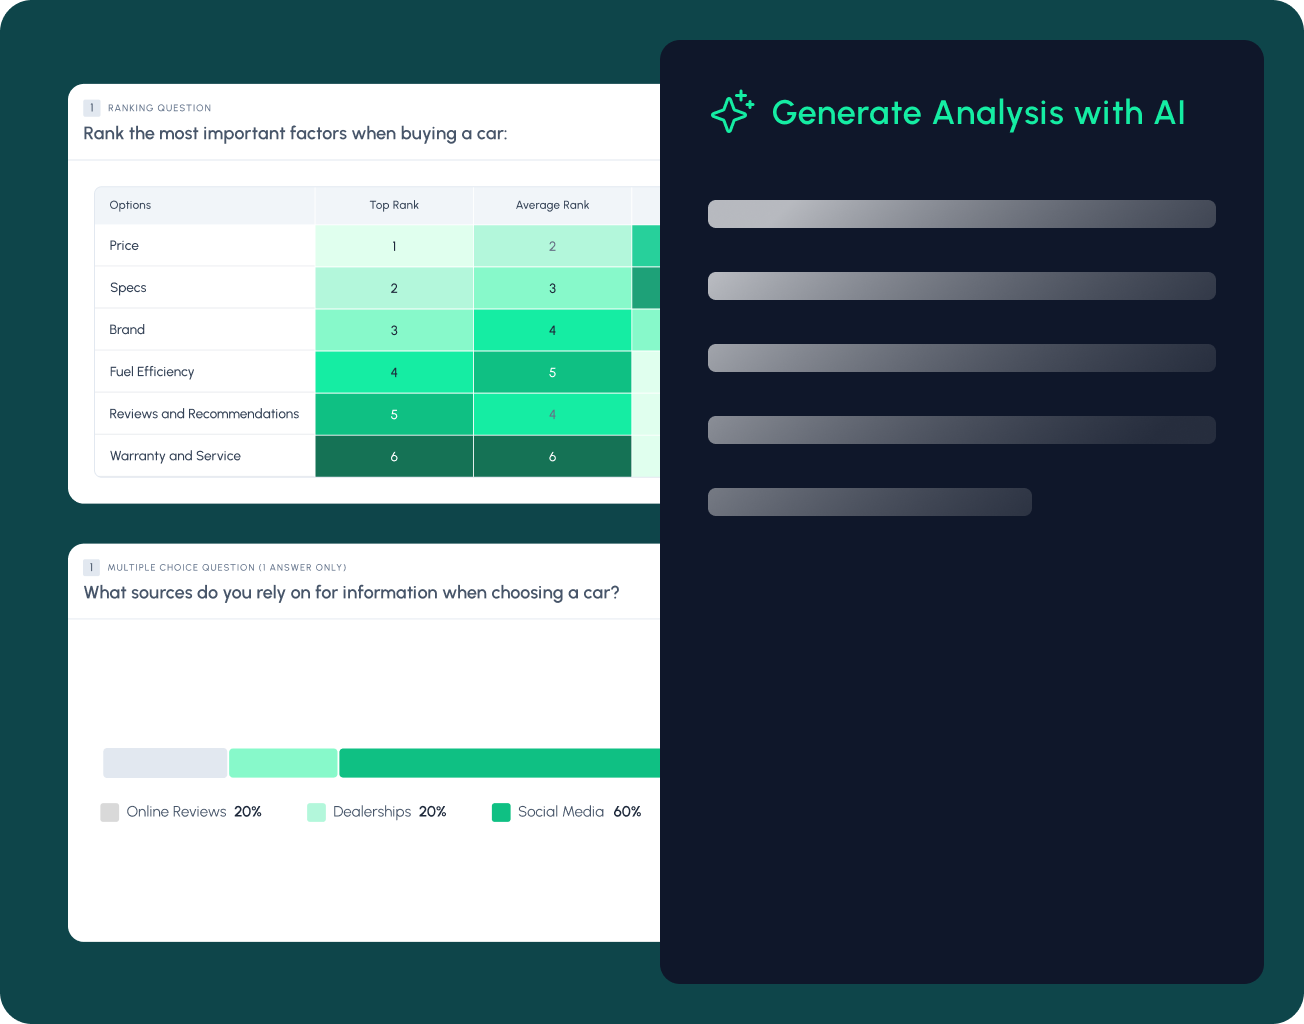
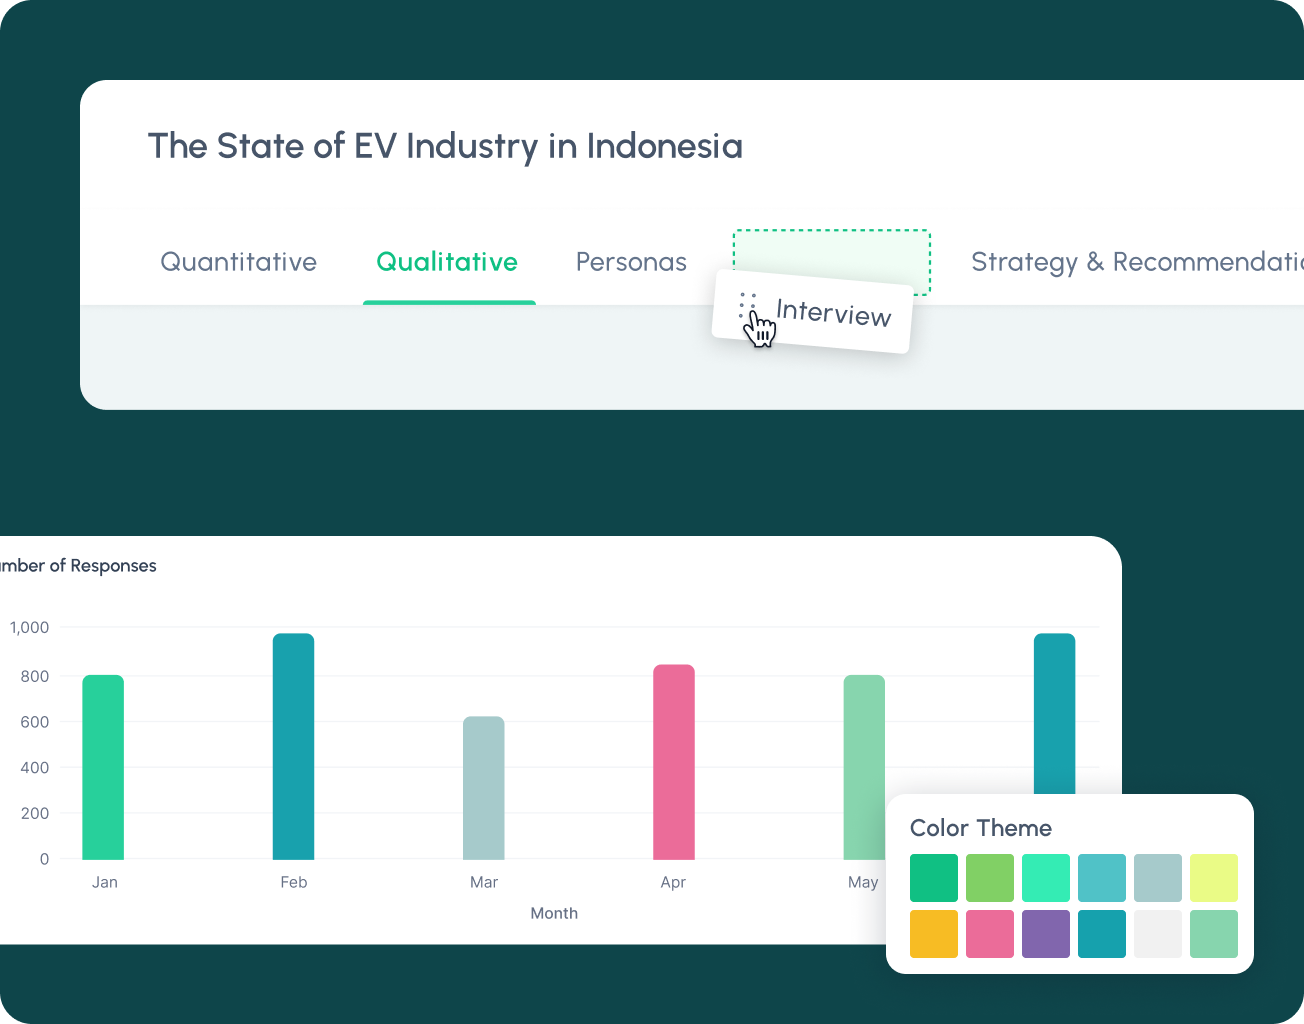
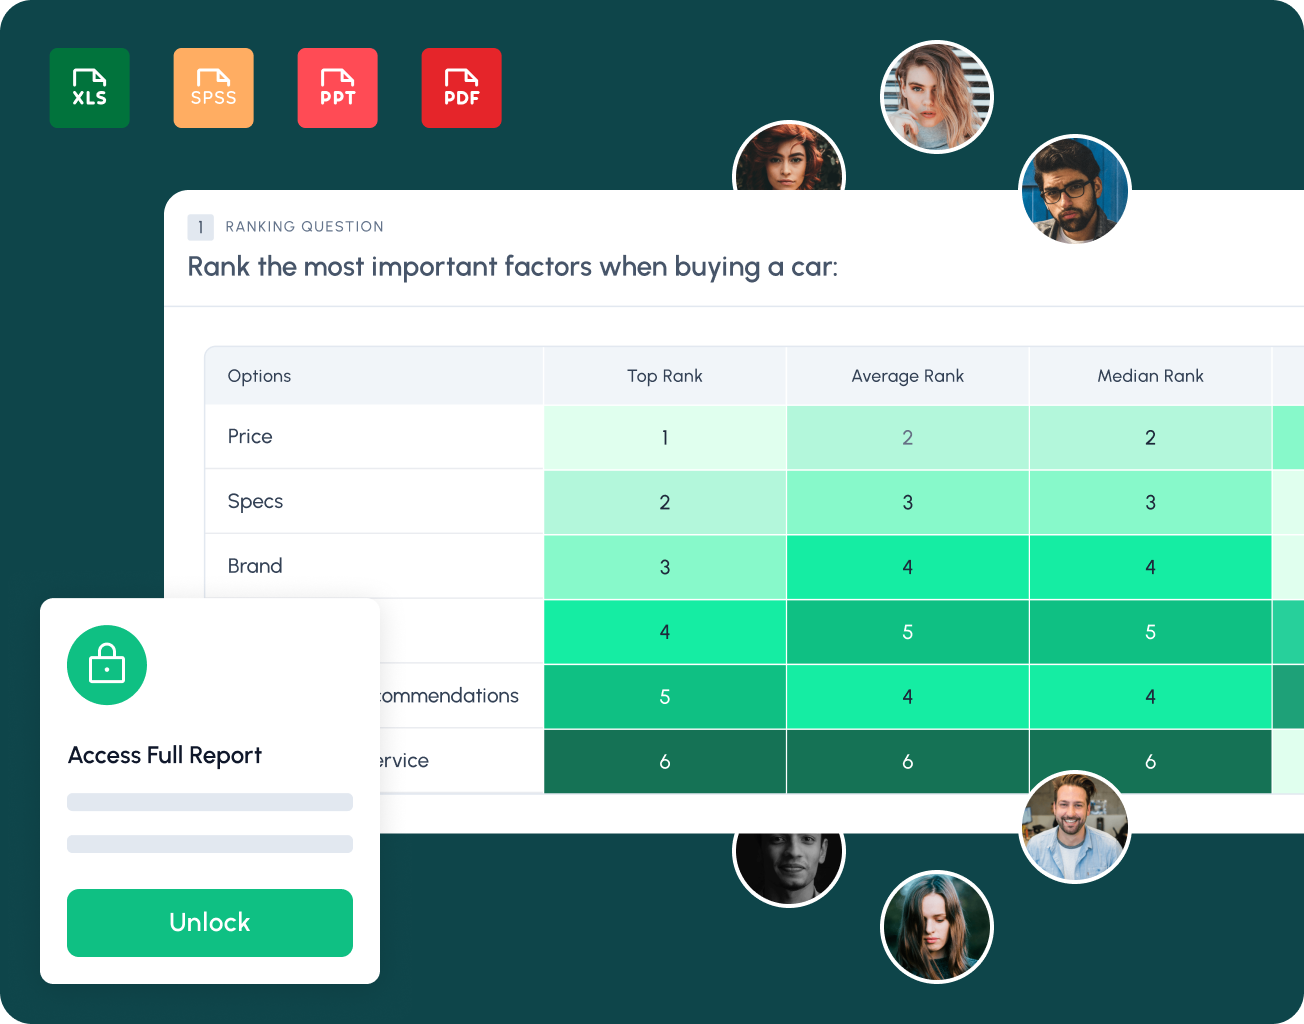
Your report is ready and visualized. You can now add analyses, customize the style, share it, and more.
Quickly transform your XLS surveys into interactive visual data. Just upload your file and enjoy real-time visualization.
Use our various tools to split, filter, and segment your data from any angle. Go further by letting our AI generate analysis for each question or for the entire report for you.
Our reports are like LEGO blocks, allowing you to combine and customize them your way. Create sections, add interviews, and choose from a variety of colors and chart types to match your brand’s style.
Control who sees your report by sharing through secure links, gating access with forms or passwords, and exporting in your preferred format.
When data visualization and reporting used to be a headache, wasting your time and resources.
Sit back with your coffee while our platform does the heavy lifting. Explore your data effortlessly and make decisions with confidence.
Easily collect, analyze, and report data with just a few clicks.