Quick answer. Seasonality in brand tracking means a brand’s awareness or consideration can rise or fall in a given month for seasonal reasons alone, because many categories move with the calendar. Before reading a change as the brand’s own, compare it with how your competitors moved over the same months, and, once you have a year of data, with the same month last year.
In season, more shoppers, more ads and fresher memories move every brand’s numbers at once
Three things happen in season, and none of them is about your brand.
- More people are shopping the category. When people are in the market, they pay more attention to it, so recall and consideration can rise for many brands at once.
- Everyone advertises at the same time. In peak months, your competitors spend too. Your share of attention can fall even as your spend goes up.
- Recent buyers remember. People who just bought in the category remember the brand they chose. After the season, that memory fades back.
Official statistics treat this as normal. The US Census Bureau adjusts its monthly retail sales for seasonal, trading-day and holiday effects before comparing months.
In our experience, seasonality is one of the most common sources of false alerts in brand tracking.
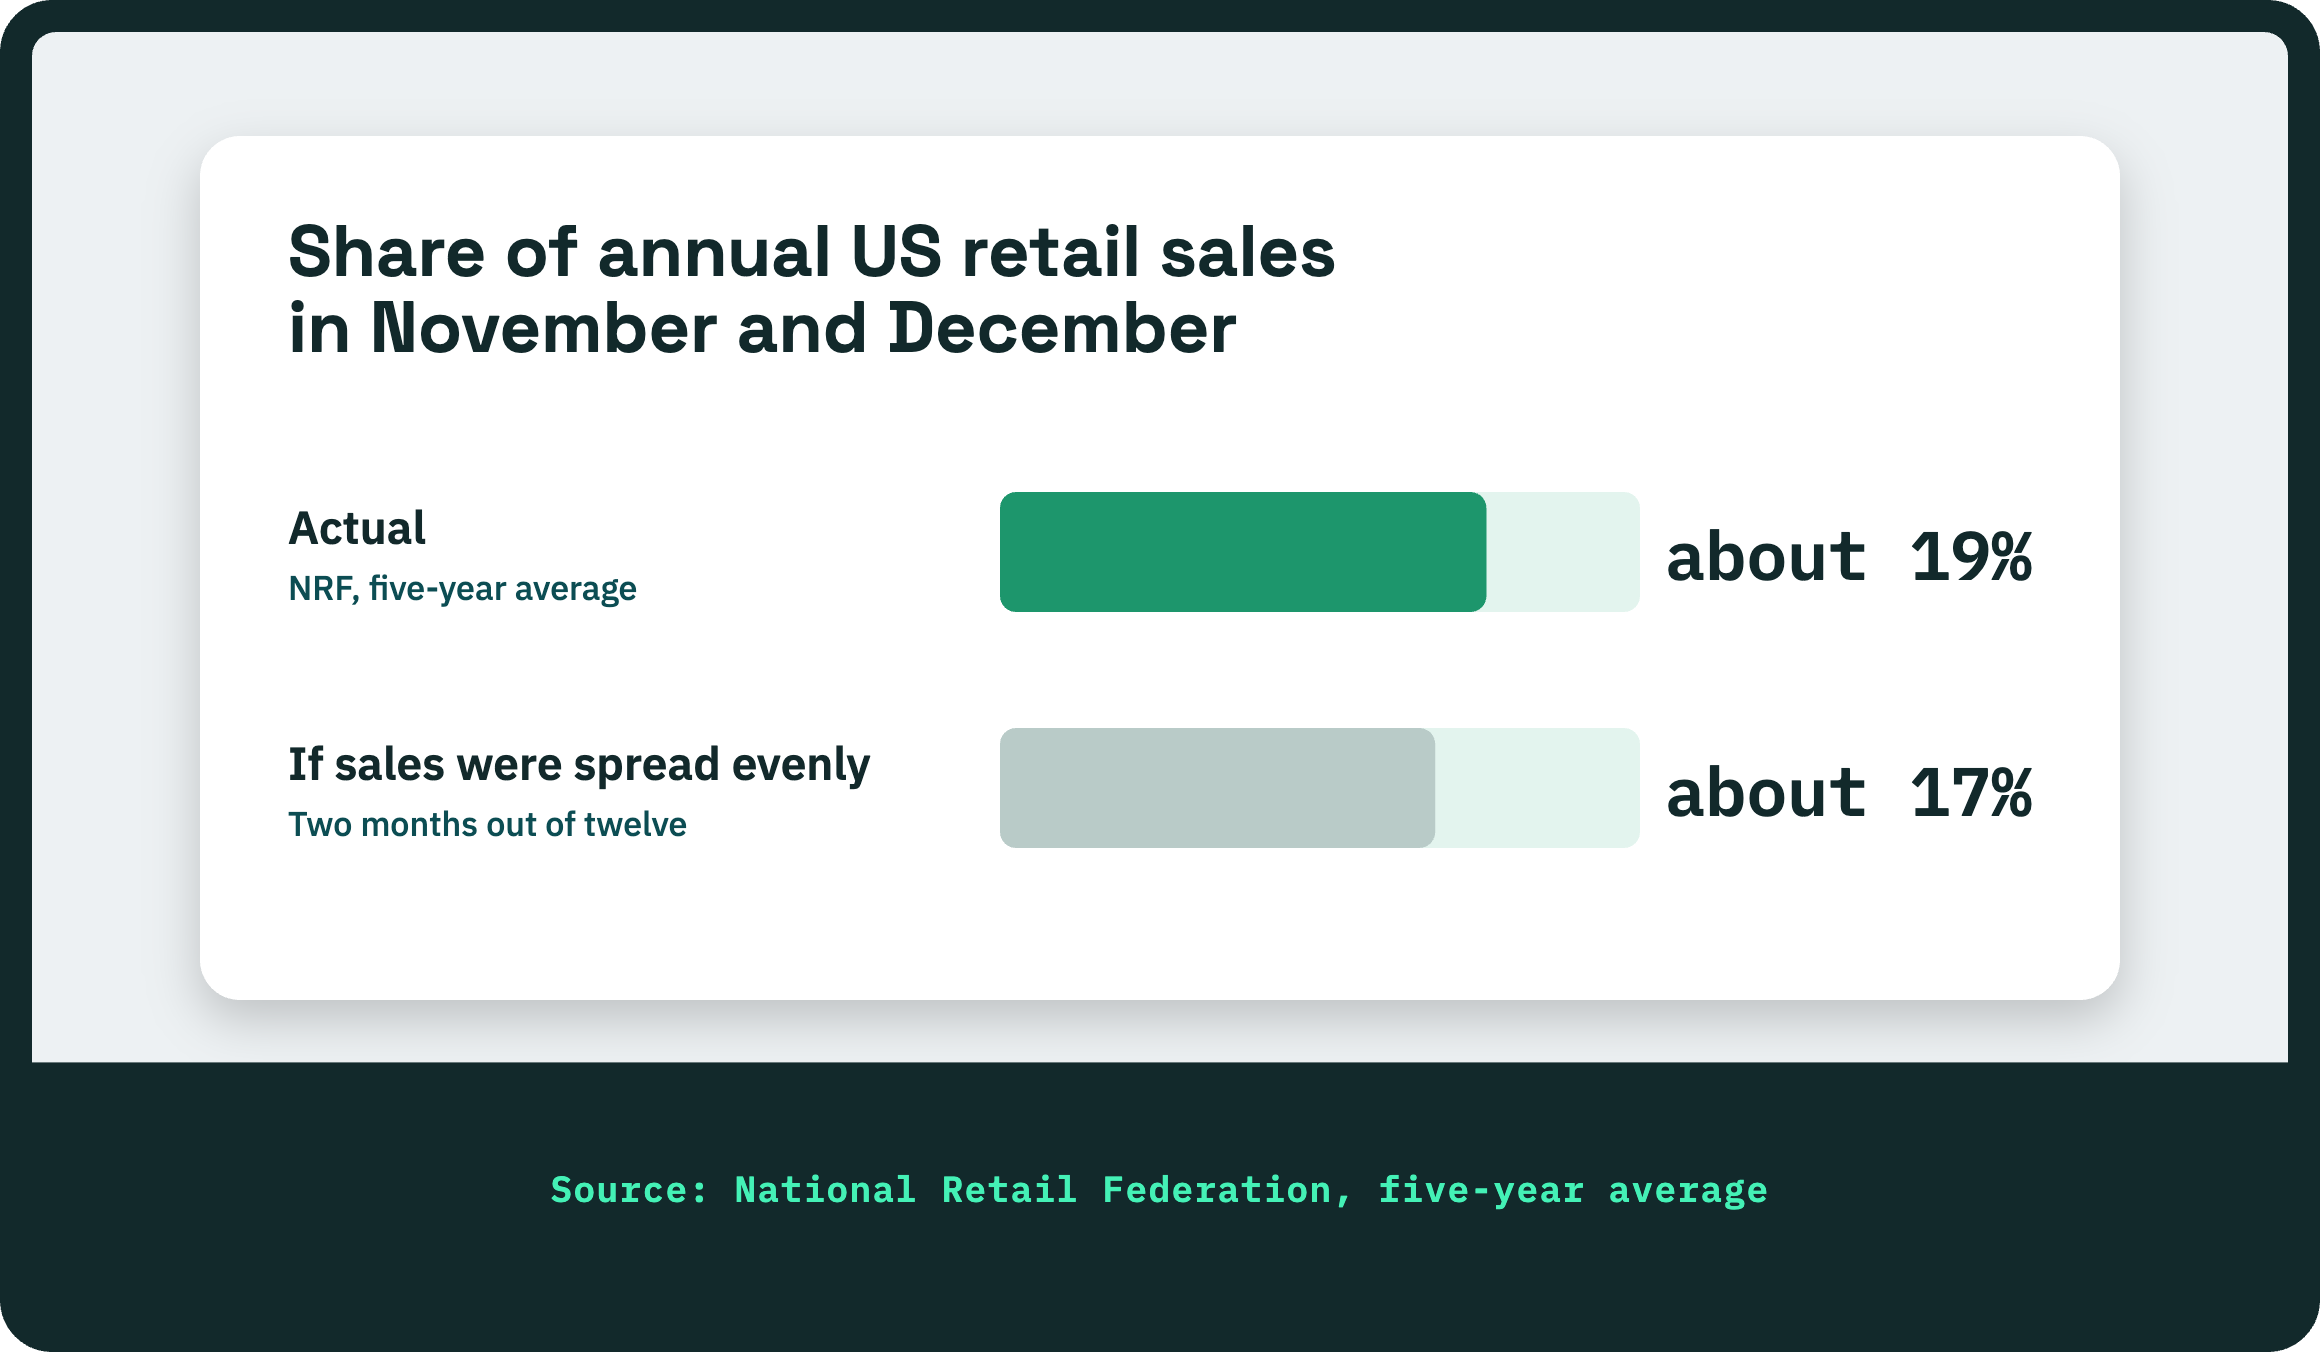
The holiday season is the clearest case: about 19% of US retail sales fall in November and December
The holiday season is the clearest example. According to the National Retail Federation, November and December together averaged about 19% of annual US retail sales over the past five years, against about 17% if sales were spread evenly across the year.
Other categories follow their own calendar: sun care in summer, school supplies in August, fitness in January. Those are illustrations, not measured curves.
Knowing your category’s seasonal profile from the start helps you expect the peaks.
How to tell a seasonal move from a real one: competitors, the single month, and last year
Compare with your competitors. Look at the median move of your competitive set. If the whole set rose in December, December rose, not your brand.
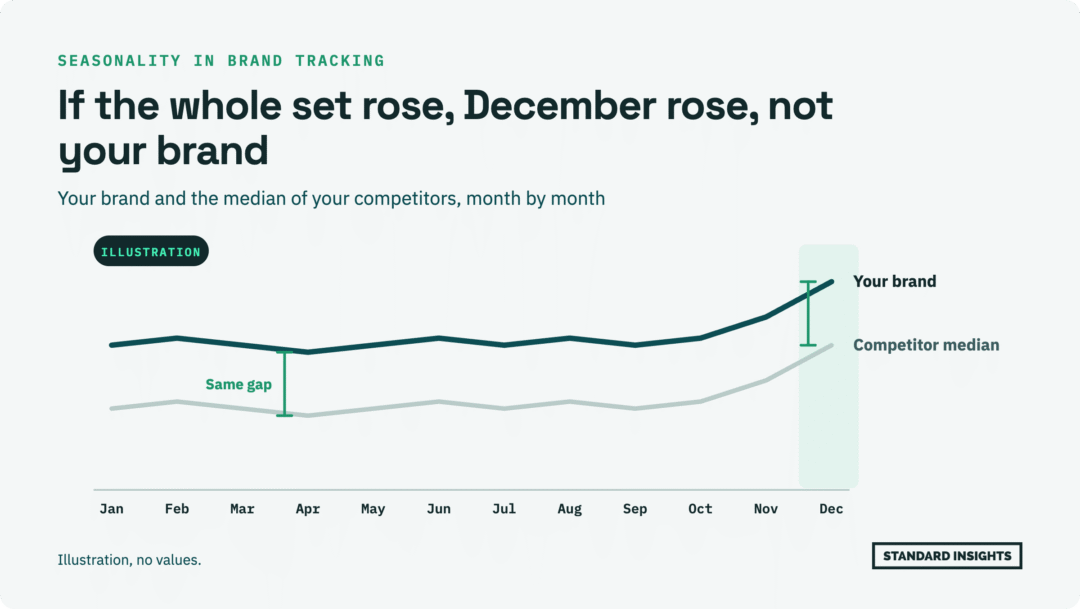
Watch for many brands moving at once. When awareness moves for three or more brands together, it’s more likely the season or the measurement than every brand gaining at the same time. On consideration, it can be a real shift in the category.
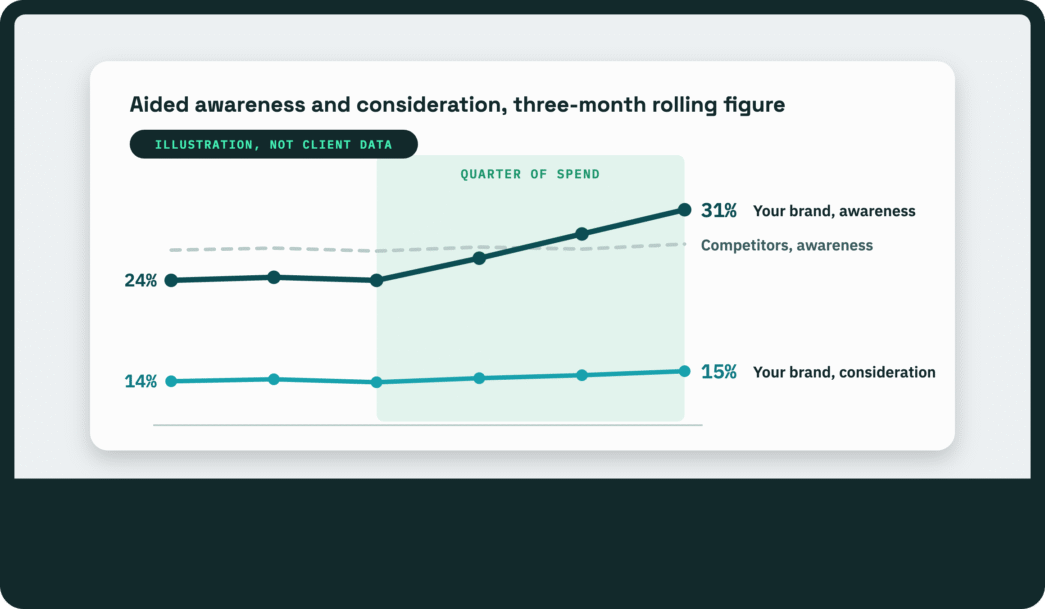
Read the single month too. A three-month rolling figure smooths out noise, but it also spreads a seasonal peak over three months. Quirk’s made the same point back in 2016: rolling data dampens month-to-month changes, so emerging trends can be hidden. Look at the single month as well, keeping its wider margin in mind (about ±5.7 points on 300 people, against ±3.3 on the rolling figure). The margin of error article explains the bar.
Compare with last year, once you can. The same month last year is the cleanest check, and it only exists from the second year of tracking.
Whichever check you use, describe what moved and when, not why.
Why a seasonal swing needs monthly data to show up
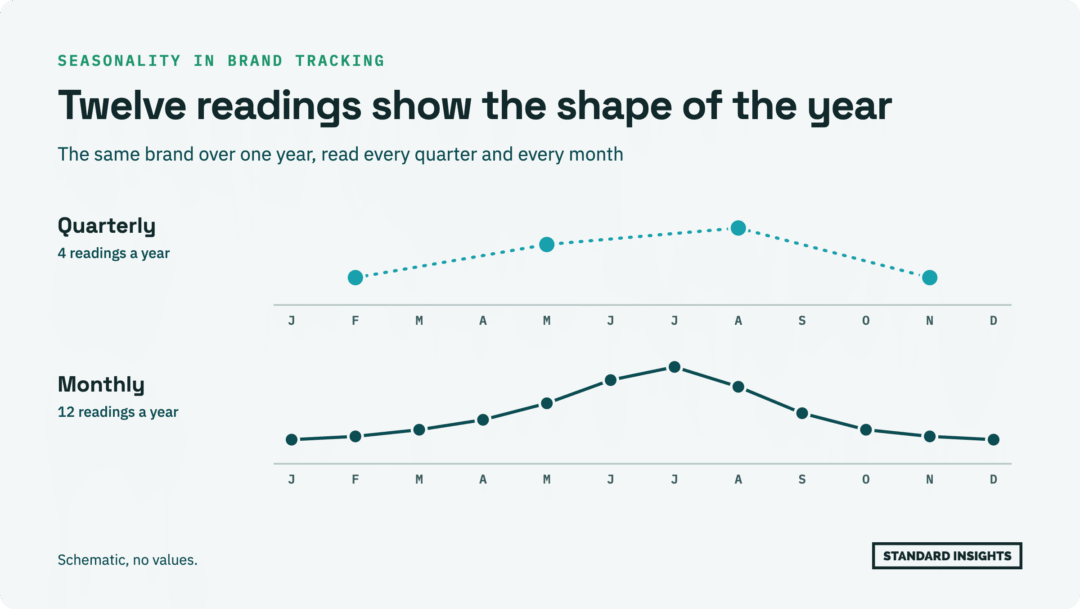
A reading every three months gives you four points a year. That isn’t enough to tell a seasonal swing from a trend. Twelve monthly points show the shape of the year: where the peaks are, how deep the dips go, and whether this year looks like the last. For how brand tracking works overall, see What is brand tracking? How it works and who does it.
FAQ
Does seasonality affect brand awareness?
It can lift recall and consideration across a whole category in peak months. That’s why a brand’s move is read against its competitors’ over the same months.
How do you handle seasonality in brand tracking?
Compare with the median move of your competitive set each month, and from the second year, with the same month last year. Statistical seasonal adjustment needs several years of history, which a new tracker doesn’t have yet.
Why did all brands in my category go up at once?
On awareness, that usually points to the season or the measurement, not to every brand gaining at once. On consideration, it can be a real shift in the category.
Should I pause tracking outside my season?
No. The off-season months are the baseline that makes the peak readable.
Method note
Margins of error are computed with the standard formula: 95% confidence, simple random sample, for a result around 50%. The seasonal categories in this article are illustrations, without measured figures.
Sources
- National Retail Federation, Winter holiday FAQs: https://nrf.com/research-insights/holiday-data-and-trends/winter-holidays/winter-holiday-faqs
- US Census Bureau, seasonal adjustment factors for monthly retail trade: https://www.census.gov/retail/marts/www/adfactor.html
- Quirk’s, “Is your brand moving in the right direction?” (Joe Abruzzo, 1 Mar 2016): https://quirks.com/articles/is-your-brand-moving-in-the-right-direction
Standard Insights’ tracker reads every month against your competitors and labels each move confirmed, reverted or emerging, so a seasonal peak that comes back down reads as reverted, not as a gain. See Brand Tracking. For a monthly read on brands and consumers, subscribe to Brands & Consumers.