Quick answer. When finance asks you to prove brand marketing ROI, brand tracking won’t give a dollar figure, but it gives the brand what finance already has for sales: one stable number, measured the same way every month against your competitors, that shows whether more people know you and would consider you since you started spending. Put your spend dates on the same line and state the margin of error, and you can show what moved and when, which is honest about timing and says more about the brand than clicks and reach.
Why clicks and reach don’t answer a CFO’s question about the brand
Impressions, reach and engagement tell you how many people saw an ad and how many reacted. They don’t tell you how many people now know your brand, or would consider buying from you. That’s the question a CFO is asking when they look at a brand budget.
Often the brand has no number of its own, however much is spent on it. So when the question comes, marketers reach for whatever they have.
The pressure is real. In The CMO Survey (January 2026, 308 marketing leaders at US companies), 56% said marketing feels increasing pressure from the CFO to prove its value. Asked how marketing copes with that pressure, 70.6% said it shifts toward short-term impact over long-run gains.
What a CFO wants is one brand number that stays comparable, month after month
A CFO follows revenue, margin and cash on a fixed schedule, with fixed definitions. The brand needs the same thing: one number, measured the same way, every month.
That means always on, not switched on for a campaign. A number measured only around a campaign has no real “before” and no “after”. A continuous series does: it shows the brand’s normal level, any change, and whether the change held.
The CFO and the marketer don’t want quite the same thing. The CFO wants a stable indicator; the marketer may worry about a bad month they’ll have to explain. A rolling figure and a stated margin of error help here: a weak month reads as noise when it is noise, instead of as an alarm.
A monthly tracker turns the brand into a number you can follow: same questions, same people, same competitors
A tracker asks the same questions to the same kind of people about the same competitors every month. Change any of those and the line breaks, so the setup stays fixed for the year.
Each month’s sample is small on its own. One month of 300 people carries a margin of error of about ±5.7 points. Averaging the last three months (900 people) brings it down to about ±3.3 points, which is why a tracker can report that rolling figure instead.
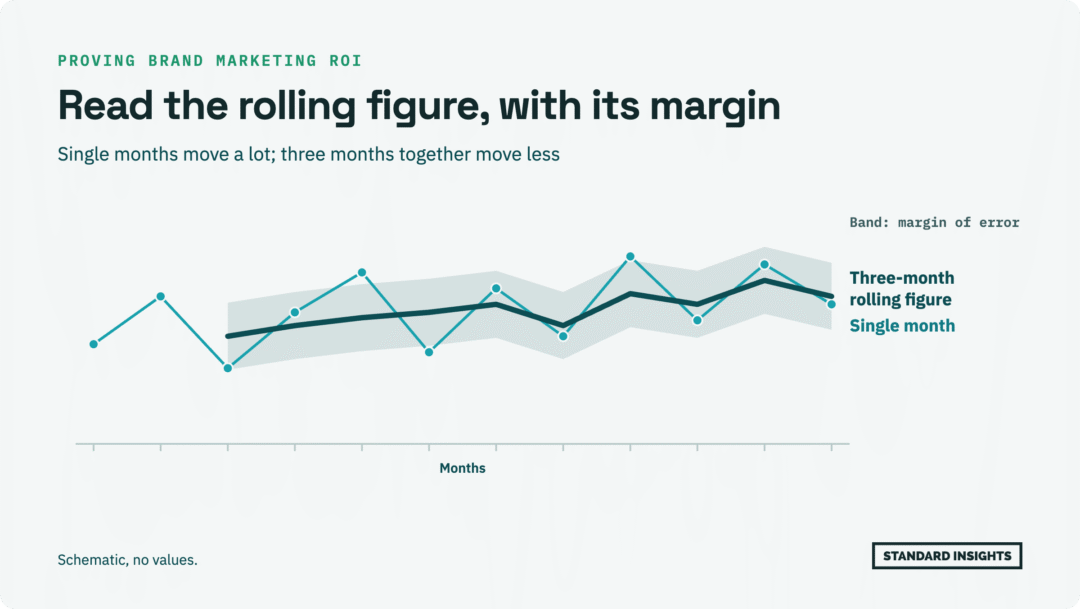
A change also has to be bigger than the noise. Between two single months of 300 people, a brand needs to move about 8 points before the change counts. The margin of error article explains the bar in detail.
The baseline comes first. A tracker’s first report usually arrives about a month after setup, and the rolling figure is readable from the third month. To judge a spend, the tracker needs to be running before it starts, ideally a quarter ahead. For how trackers work overall, see What is brand tracking? How it works and who does it.
Bring three numbers: awareness, consideration, and the gap between them, each next to your competitors
- Aided awareness: how many people recognize your brand when they see it in a list (“Which of these brands have you heard of?”).
- Consideration: how many would consider buying from you (“Which would you consider buying from?”).
- The gap: how many people know you but don’t consider you.
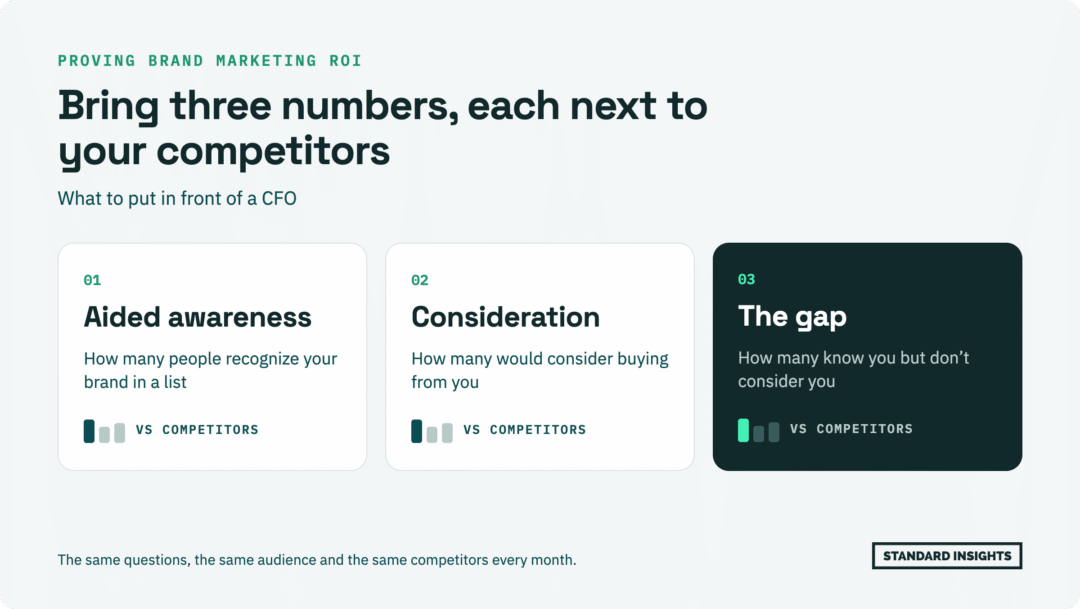
Competitors are the check a CFO will ask for. If every brand in your category moved, the category moved, not your brand. So read your change against the median change of your competitors.
Three things can fool you:
- Dilution. When awareness rises, consideration among people who know you can fall, even while awareness grows as planned: new people know you but haven’t warmed to you yet. Check consideration on the full sample too.
- Aided awareness rarely falls fast. A sudden drop is a reason to check the measurement before you call it market news.
- Seasons are the main source of false movement. Compare with the same months, and with your competitors.
Put it on one slide: the trend line, the spend dates, what moved, what didn’t, and the margin
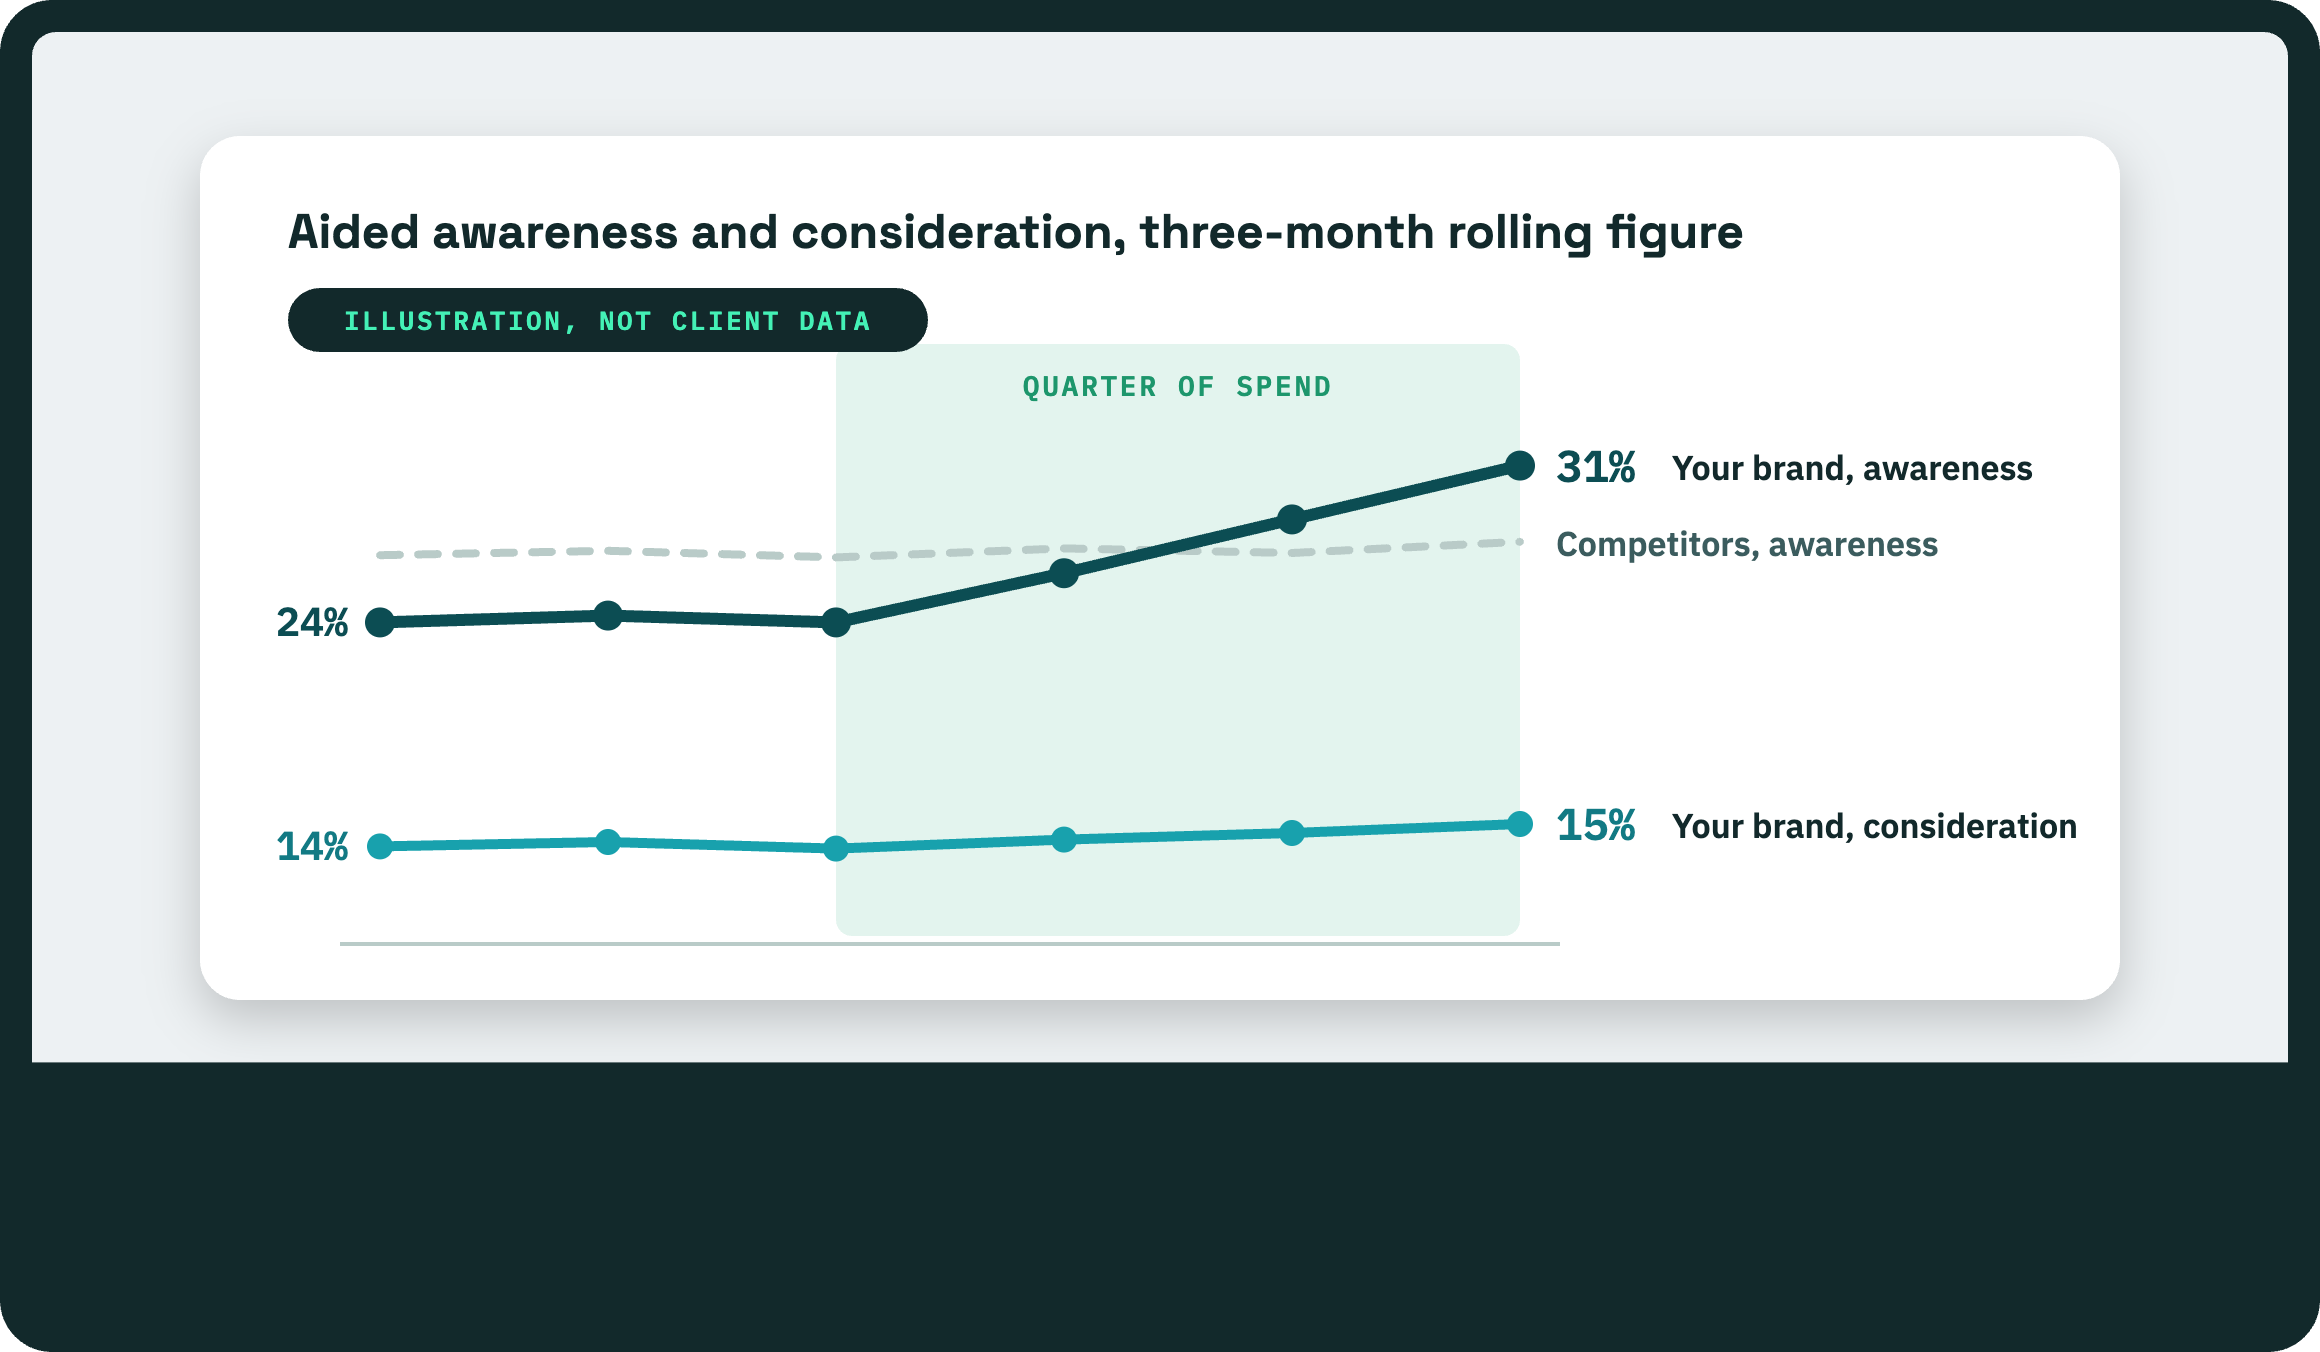
One chart: awareness and consideration over time, for you and your competitors, with the spend periods shaded. Under it, one sentence on what moved beyond the margin and one on what didn’t.
On the slide, state both the margin on the number and the change it takes to count. For example: “300 people a month; ±3.3 points on the rolling figure; a change between two quarters needs about 4.6 points.”
Here’s an illustration of how that reads, not a real client. Awareness on the rolling figure goes from 24% to 31% over the quarter of spend, while competitors stay within 1 point. The 7-point move clears the bar of about 4.6 points between two quarters, and flat competitors rule out a category-wide move. Consideration goes from 14% to 15%, inside the margin: it didn’t move.
That last line matters. A finance reader discounts a deck where everything went up, and “this didn’t move” is what makes the rest believable. Show the same slide every month or quarter: the value is in the series, not in one reading.
Brand numbers show what moved and when; proving why takes a test or a model
A tracker shows movement and timing. It can’t rule out other causes: a price change, new distribution, a competitor’s move, the news, the season. So say that awareness rose while you were spending, and leave cause to a test or a model.
For a dollar figure, companies use a marketing mix model, which links spend to sales history, or a controlled test. Google made its open-source marketing mix model, Meridian, available to everyone in January 2025. Those tools answer a different question from a tracker, and they take more data and more work.
A CFO trusts brand numbers more when the marketer is clear about what they can’t show.
FAQ
How do you prove brand marketing ROI?
A dollar ROI needs a model that links spend to sales over time, or a controlled test. Brand tracking does something simpler: it gives the brand a monthly number against competitors, with its margin of error, so you can see whether it moved while you were spending.
What brand metrics matter to a CFO?
Few and stable: aided awareness, consideration and the gap between them, each next to competitors. Measured the same way every month, with the margin stated.
How long before brand spend shows results?
On a monthly tracker, a change usually needs two or three months to clear the noise. So expect to read it about a quarter after the spend starts.
Should brand tracking run all year or only around campaigns?
All year. Without the months before and after, there’s nothing to compare a campaign month with, and you can’t tell a season from a real change.
What if the numbers didn’t move?
Say so. A flat line inside the margin of error means any change was too small to detect at that sample size, which is still useful for the next budget decision.
Method note
Margins of error are computed with the standard formula: 95% confidence, simple random sample, for a result around 50%. The worked example in the slide section is an illustration, not client data. The CMO Survey figures are as reported by the survey’s authors: fieldwork 7 to 29 January 2026, 308 marketing leaders at for-profit US companies; the base for the 70.6% figure isn’t stated.
Sources
- The CMO Survey 2026, Highlights and Insights Report (Duke University, Deloitte, American Marketing Association): https://cmosurvey.org/wp-content/uploads/2026/04/The_CMO_Survey-Highlights_and_Insights_Report-2026.pdf
- MarTech, “Google releases its open-source marketing mix model to all” (Jan 2025): https://martech.org/google-releases-its-open-source-marketing-mix-model-to-all/
Standard Insights’ tracker gives you that slide every month: your brand against your competitors, a written read by our analysts, each move labelled confirmed, reverted or emerging, and the reasons buyers give for considering you or not. See Brand Tracking. For a monthly read on brands and consumers, subscribe to Brands & Consumers.