fbpx

Net Promoter Score® Calculator

Try our free NPS score calculator to understand how happy your customers are with your product or service.

What’s your Net Promoter Score® (NPS)?

Enter the number of respondents in the fields below:

Detractors
😞
0
😞
1
😞
2
😞
3
😞
4
😞
5
😞
6
Passives
😐
7
😐
8
Promoters
😊
9
😃
10
Your NPS score is
0
😊
0
Promoters
0%
😐
0
Passives
0%
😞
0
Detractors
0%

Prefer another method? – Try our CSAT Calculator

Net Promoter Score and NPS are registered trademarks of Bain & Company, Inc., Fred Reichheld and Satmetrix Systems, Inc

What Is a Net Promoter Score (NPS)?

A Net Promoter Score (NPS) is a customer loyalty metric that measures how likely your customers are to recommend your product or service to others. It’s based on a single question:

“On a scale of 0 to 10, how likely are you to recommend us to a friend or colleague?”


Detractors

(Score 0–6)

Passives

(Score 7–8)

Promoters

(Score 9–10)

What Does Your NPS Score Mean?

Your NPS score ranges from -100 to +100 and provides insights into customer loyalty. Here’s what it means:

-100 to -50
-49 to -1
0 to 30
31 to 50
51 to 70
71 to 80
81 to 100
Hover over or tap a bar to see more info.

How Does Your Score Compare?

Score Ranges and Interpretation

NPS Range Rating What It Means
70+ World-Class Exceptional customer loyalty. Customers are highly likely to recommend your brand.
50–70 Excellent Strong customer satisfaction and loyalty.
30–50 Good Solid performance, but there’s room for improvement.
0–30 Needs Improvement Below average. Focus on addressing customer concerns.
Below 0 Poor Urgent action required. Many customers are dissatisfied.

Industry Benchmarks

Industry Good NPS Excellent NPS Top Brands (NPS)
Technology 40–60 60+ Tesla (96), Apple (72)
Retail 30–50 50+ Amazon (69), Costco (77)
Financial Services 20–40 40+ USAA (75), Charles Schwab (70)
Healthcare 30–50 50+ Kaiser Permanente (68)
Hospitality 30–50 50+ Southwest Airlines (62)
Telecommunications 20–40 40+ Verizon (40), T-Mobile (50)

How to Improve Your NPS

Improving your Net Promoter Score (NPS) requires a focus on customer feedback and strategic actions.
Here’s a concise guide to help you boost your score:

1. Understand Your Baseline

Start by measuring your current NPS and tracking trends over time. Regular surveys will help you spot patterns and measure progress.

2. Engage with Detractors (0–6)

Unhappy customers can harm your reputation. Here’s how to turn them around:

  • Reach Out: Contact detractors personally to understand their concerns.
  • Resolve Issues: Address complaints promptly and show genuine care.
  • Example: A detractor who complained about slow shipping might become a promoter if you offer free expedited shipping.

3. Convert Passives (7–8)

Passives are satisfied but not loyal. Turn them into promoters by:

  • Offering Incentives: Provide discounts or loyalty programs.
  • Personalizing Experiences: Use data to make interactions feel special.
  • Example: Send a personalized thank-you note with a discount code.

4. Leverage Promoters (9–10)

Promoters are your biggest advocates. Encourage them to:

  • Leave Reviews: Ask for positive testimonials.
  • Refer Others: Reward referrals with perks or discounts.
  • Example: Offer a free product upgrade for every three referrals.

5. Address Pain Points

Identify recurring issues in detractors’ feedback and fix them. For example, simplify a confusing checkout process.

6. Benchmark Against Competitors

Compare your NPS to industry averages and top-performing brands. For instance, if your NPS is 50 in retail, aim to match Amazon’s score of 69.

7. Build a Customer-Centric Culture

  • Train Employees: Teach teams how their roles impact customer satisfaction.
  • Hold Regular “NPS Huddles”: Discuss feedback and brainstorm solutions.

8. Use Technology to Scale

  • Automate Feedback Collection: Use tools to send surveys via email, SMS, or in-app notifications.
  • Analyze Data: Leverage AI to categorize feedback and identify trends.

9. Close the Loop

Follow up with customers to show you’ve acted on their feedback. For example, email them about improvements made based on their input.

10. Continuously Improve

Stay adaptable and invest in training to keep your NPS strategy effective.

Why Does a Good NPS Matter?

A high NPS score isn’t just a number—it’s a key driver of business success. Here’s why:

Boosts Customer Retention

  • Loyal customers are more likely to stay with your brand, reducing churn and increasing lifetime value.

Drives Referrals

  • Promoters act as free marketers, bringing in new customers through recommendations.

Predicts Business Growth

  • Companies with high NPS often experience faster revenue growth and stronger market performance.

Example:

  • Tesla (NPS: 96): Their world-class NPS reflects exceptional customer loyalty, driving their rapid growth.
  • Amazon (NPS: 69): Their strong NPS highlights their focus on customer satisfaction, making them a retail leader.

How to Calculate NPS?

Calculating your Net Promoter Score (NPS) is simple and straightforward. Follow these steps to measure your customer loyalty:

Step 1: Collect Responses

Ask your customers the NPS question:

“On a scale of 0 to 10, how likely are you to recommend our product/service to a friend or colleague?”

Step 2: Categorize Responses

Based on their answers, group your customers into three categories:

  • Promoters (9–10): Loyal and enthusiastic customers who will recommend your brand.
  • Passives (7–8): Satisfied but unenthusiastic customers who may switch to competitors.
  • Detractors (0–6): Unhappy customers who may spread negative feedback.

Step 3: Calculate percentages

To find your NPS score, first figure out the percentage of customers who are Promoters and the percentage who are Detractors. Then, subtract the percentage of Detractors from the percentage of Promoters. The result is your NPS score.

Calculate NPS Score - FORMULA

How to Implement NPS Surveys

Learn how to deploy Net Promoter Score surveys to gauge customer loyalty and identify areas for improvement.

Survey Setup

Create clear, unbiased surveys using the standard NPS question. Consider timing and channel selection.

Sample Selection

Choose representative customer segments. Ensure adequate sample size for statistical significance.

Analysis

Track trends over time. Segment responses by customer type, product line, or region.

Follow-up

Implement closed-loop feedback. Contact detractors within 48 hours. Thank promoters for their support.​

Frequently Asked Question

How often should we measure NPS?

Most companies measure NPS quarterly or bi-annually. However, the frequency can depend on your business type and customer interaction cycle. Regular measurement helps track trends and the impact of customer experience improvements.

NPS benchmarks vary due to different customer expectations, competition levels, and industry-specific challenges. For example, technology companies often see higher scores due to product innovation and brand loyalty, while telecommunications typically score lower due to service issues and intense competition.

Research shows a strong correlation between NPS and business growth. Companies with higher NPS typically experience 20% higher growth rates compared to competitors. This is because satisfied customers tend to spend more, stay longer, and refer others, creating a positive cycle of sustainable growth.

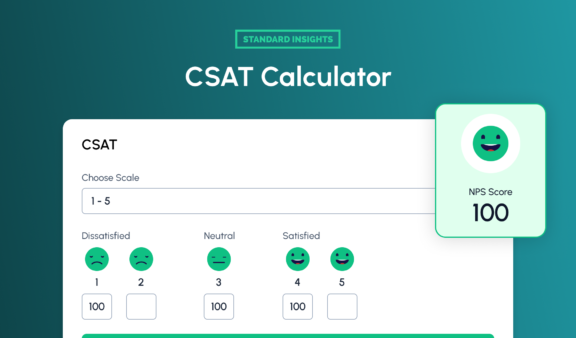
CSAT (Customer Satisfaction Score): Measures customer satisfaction with a specific interaction or product. It helps businesses understand how well they meet expectations at a particular point in time.

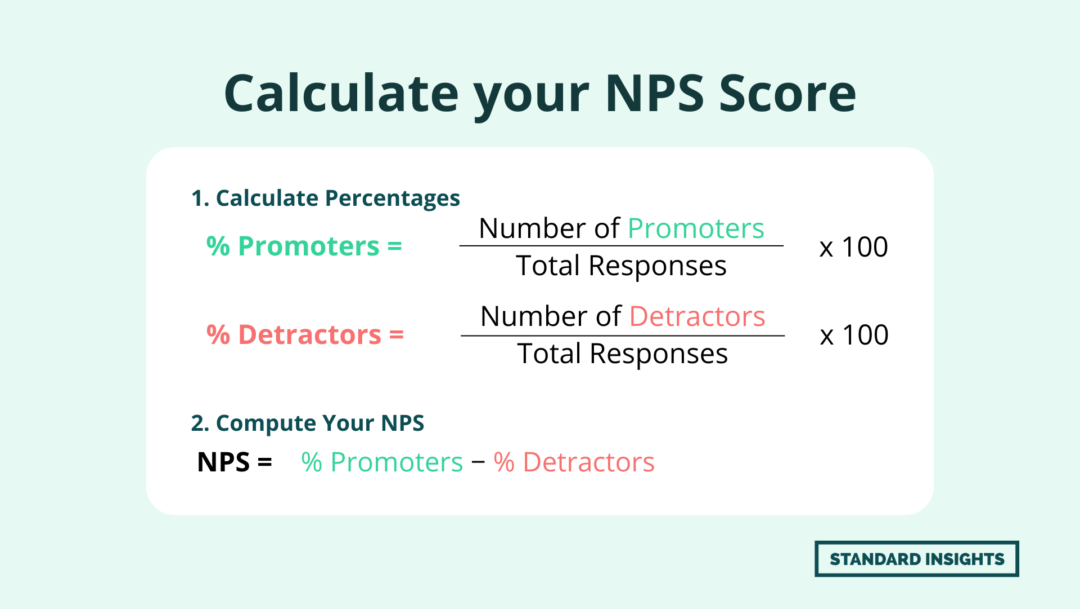
NPS (Net Promoter Score): Gauges overall customer loyalty and the likelihood that customers will recommend a company to others. NPS reflects long-term customer sentiment and their commitment to the brand.

Learn more about Customer Satisfaction and how to measure it using our CSAT Calculator.

Explore Our Other Market Research Tools

CSAT Calculator

Instantly calculate your Customer Satisfaction Score (CSAT) based on satisfied, neutral, and dissatisfied responses.

Sample Size Calculator Thumbnail

Quickly calculate the ideal sample size for your study based on confidence level, margin of error, and population size.

Margin of Error Calculator

Easily determine the margin of error for your survey results using sample size, population, and confidence level.

Start your next consumer research

Book a personalized demo with our team and receive free access credentials shortly thereafter.