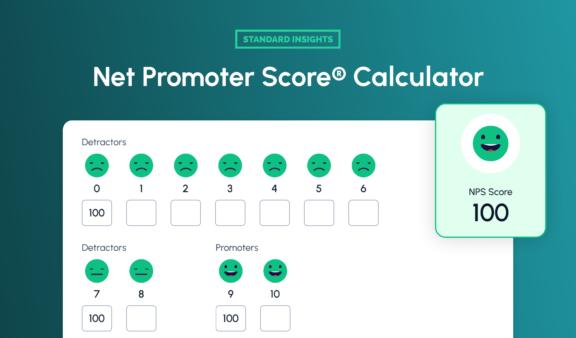
Calculate your Net Promoter Score instantly with our free NPS calculator. Measure customer loyalty, interpret results, and boost satisfaction.
Our IR Estimator helps you understand how challenging it can be to survey your target audience. The higher the percentage, the easier it is. Follow the instructions below to use the tool and learn more about incidence rates in market research.

Enter the demographics (country, age, gender) for your target audience.

Specify your qualification criteria to refine your audience.

Get an instant incidence rate estimate and begin surveying your audience on our market research platform.
An incidence rate is a key metric in market research that indicates the proportion of a target population that meets specific criteria for a survey or study. Think of it as the percentage of people within a larger group who fit your research needs.
For example, if you’re conducting a survey on electric vehicle owners, the incidence rate would be the percentage of the general population who own electric vehicles.
Incidence rate is crucial in market research as it helps determine the feasibility and cost-effectiveness of a study. For example, if you’re researching a niche product like high-end audio equipment and find that the incidence rate is low, this indicates that only a small percentage of consumers fit your target audience. In such cases, it might be better to adjust your project scope—considering a smaller sample size or even shifting from a quantitative approach to qualitative methods, like interviews or focus groups, to gain deeper insights.
Conversely, if the incidence rate is high for a broader category, such as general electronics consumers, it suggests that many people meet your criteria. This makes it easier and more cost-effective to find qualified respondents, allowing you to conduct a larger quantitative study without extensive resource strain.
If you are unsure about your audience size, use our audience size calculator to help plan your research effectively!
Your incidence rate (IR) gives you important insights into how common your target audience is within the larger population. A high IR means that many people meet your criteria, making it easier to find qualified respondents and saving you time and resources in data collection. On the other hand, a low IR might mean you’ll need to use more targeted recruitment strategies or start with a larger sample size to get reliable results.
A lower IR isn’t necessarily a bad thing—it indicates that your target audience is relatively small, which may require more effort and resources to reach the desired sample size. For instance, if your IR is 5%, it means that out of every 100 people, 5 are likely to be part of your target group.
| Criteria | United States | Germany | Japan | Brazil | India | Australia | Thailand |
|---|---|---|---|---|---|---|---|
| Coffee Drinkers | 100%-75% | 100%-75% | 100%-75% | 100%-75% | 49%-30% | 100%-75% | 74%-50% |
| Wears Glasses | 49%-30% | 29%-20% | 29%-20% | 49%-30% | 29%-20% | 49%-30% | 49%-30% |
| Work in Retail | 19%-15% | 29%-20% | 19%-15% | 14%-10% | 9%-7% | 14%-10% | 19%-15% |
It’s important to recognize that incidence rates are not fixed over time. As countries develop and trends shift, incidence rates can change. For example, many years ago, who would have thought that Japan, a tea-drinking culture, would have so many coffee drinkers today?
Calculating the incidence rate is straightforward. You divide the number of individuals who meet your criteria by the total number of individuals in the population, then multiply by 100 to get a percentage.
The Incidence Rate formula is:
IR = (Number of Qualified Respondents ÷ Total Number of Respondents) × 100%
For example:
This means that 30% of your respondents met the qualification criteria for your survey.
Understanding what impacts survey incidence rates is essential for anyone involved in research.
Here’s a quick look at the key elements to keep in mind:
Factors like age, gender, income, and location.
Influences from lifestyle choices and purchasing habits.
Shifts in consumer preferences and emerging trends.
Aspects such as values, interests, and personal attitudes.
The overall economic climate and levels of consumer confidence.
Differences between urban and rural populations.
The type of survey used (online, phone, etc.) and question design.
Rewards and benefits offered for participation.
Our Incidence Rate Estimator utilizes historical data along with project insights to provide an estimate of your audience’s incidence rates. Our AI system performs the calculations, ensuring reliable results. While they may not be 100% accurate, they offer a solid understanding of your audience’s IR. For complex or niche audiences, estimates might not be available due to limited data. Nonetheless, our tool serves as a valuable starting point for your market research.
To determine your total sample size, it’s essential to clearly define who fits into your target group. For example, if you’re researching cat owners, include individuals who have owned at least one cat. Depending on your research goals, you may also choose to include or exclude those who previously owned a cat.
The incidence rate directly impacts your sample size because a lower incidence rate means you’ll need to survey more people to find enough qualified respondents. If you can’t calculate the exact number of potential respondents, don’t worry—it’s common to work with an estimated range or an unknown figure.
For a more precise calculation, consider using our Sample Size Calculator. This tool can help you determine the ideal sample size based on your specific needs.
The incidence rate is an estimate based on available data. While we strive for accuracy, we cannot guarantee that the results will perfectly match your criteria and performance outcomes. These estimates are intended for guidance only. Additionally, keep in mind that incidence rates can change over time due to various factors.

Calculate your Net Promoter Score instantly with our free NPS calculator. Measure customer loyalty, interpret results, and boost satisfaction.

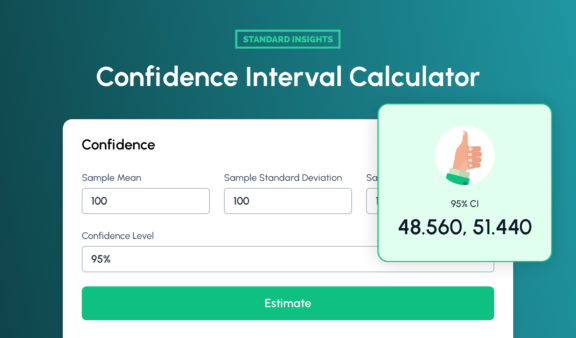
Use our Confidence Interval Calculator for quick, reliable estimates from your sample data. Ideal for data-driven decisions in research and analysis.

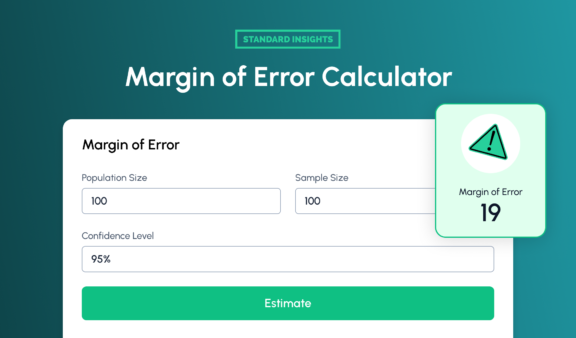
Easily determine the margin of error for your survey results using sample size, population, and confidence level.
Create your free account, and use our set of tools to conduct your research easily.