
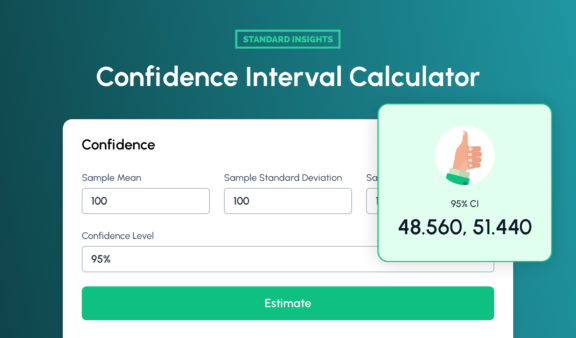
Use our Confidence Interval Calculator for quick, reliable estimates from your sample data. Ideal for data-driven decisions in research and analysis.
Try our free online sample size calculator to determine the ideal survey sample size for your project. Input your values below for instant results.
The sample size calculator uses Cochran’s formula to determine how many people you need to survey to get accurate results. Follow the steps below.

Input the total count of your target group. For large groups, rough estimates are sufficient.

Choose your acceptable level of uncertainty, typically 1-10%. Lower percentages yield more precise results.

Pick your desired certainty for results. Usually, researchers use 95%. For preliminary studies, use 90%, or 99% for utmost precision.
The Sample size is the number of people you need to survey to accurately represent a larger group. When conducting market research or gathering survey responses, you don’t need to survey the entire population—just enough to obtain statistically significant results.
For research to be reliable, your random sample must reflect the key characteristics of your target population. For example, if you’re studying smartphone users aged 18-34, your representative sample should include people from different income levels, locations, and usage patterns in proportions that match your target market.
Having the appropriate sample size is critical for obtaining valuable insights that can guide your decisions. Too small a sample can give misleading data, while too large sample sizes waste resources.
A well-calculated sample size ensures:
For example, surveying only 10 customers about a new product launch could give very different results than surveying 300 customers, as a few extreme opinions could heavily skew the smaller sample sizes. However, surveying 10,000 customers might not provide better statistical power than surveying 1,000, while significantly increasing costs and time.
The key is finding the sweet spot that gives you reliable data within your research budget and timeline. Use the sample size calculator above to determine the right number for your research.
Several key factors influence how many survey responses you need for statistically significant results. Different studies need different sample sizes – quantitative research typically needs a larger sample size than qualitative research. For instance, a product preference survey might need hundreds of responses, while detailed customer interviews could work with a minimum sample size of 20-30 participants.
Population characteristics and population proportion also matter. Groups with similar traits allow smaller sample sizes, while diverse populations need larger samples to represent all segments. Geographic distribution of your target population often requires bigger samples to ensure representation across different locations.
Consider practical constraints like budget, timeline, and ability to gather responses. Response rates significantly impact your planning – for example, with a 25% response rate, you’ll need to reach 1,600 people to get 400 survey responses. To simplify your market research, create an account on our platform.
| Example | Est. Count | Margin | Notes | Sample Size |
|---|---|---|---|---|
| Global Population | 8,000,000,000 | ±1% | Even with modern census methods, counting world population has challenges like migration and remote areas. | ~9,600 |
| YouTube Monthly Users | 2,700,000,000 | ±3% | Distinguishing between active users (daily/weekly) vs occasional viewers affects count accuracy. | ~1,100 |
| Population of India | 1,400,000,000 | ±1% | Despite regular census, rapid population changes and rural areas make exact counting difficult. | ~9,600 |
| Netflix Subscribers | 230,000,000 | ±5% | Monthly subscriber count fluctuates due to free trials, account sharing, and cancellations. | ~400 |
| Population of Luxembourg | 645,000 | ±2% | Small geographic area and strong administrative systems enable more accurate counting. | ~2,400 |
| Students in Online Course | 50,000 | ±10% | Difference between enrolled students and those who actually participate affects accuracy. | ~100 |
| Blue Whale Population | 10,000 | ±40% | Ocean size, whale migration patterns, and limited tracking technology create high uncertainty. | ~6 |
| Everest Climbers | 6,000 | ±10% | Variations in counting methods (successful summits vs attempts) affect total numbers. | ~90 |
This section explores the technical aspects of the sample size formula for those interested in the underlying statistical concepts. We’ll explain why our sample size calculator focuses on the three most practical components while simplifying more complex variables.
To determine your true population parameter, you must first be clearly define who does and doesn’t fit into your group. If you don’t know the exact size, use estimates from sources like census data, industry standard reports, membership records, or online surveys.
For instance, if you want to know about cat owners, you need to include those who have owned at least one cat. (Depending on your research goals, you may include or exclude those who previously owned a cat.)
Tip: Don’t worry if you can’t get an exact count – estimates work well for large populations.
The plus or minus figure (margin of error) shows how close your survey results will be to the true value of the overall population. Your sample proportion helps determine this range:
The confidence level represents how sure you can be that your survey sample accurately represents the general population. Your desired level affects how many responses you need. If you choose a 95% confidence level, your results will be accurate within your margin of error 95% of the time. Common levels are:
Standard deviation helps predict how varied your survey responses might be. Think of it as measuring how spread out your answers could be. For example, when asking if people drink coffee, responses might be:
Very consistent (90% yes, 10% no)
Or widely distributed (estimated proportion of 45% yes, 55% no)
To simplify calculations, our size calculator uses 0.5 (50%) as the standard deviation, ensuring enough responses regardless of variation.
Tip: Using 0.5 as standard deviation means you won’t need to conduct a pilot study to estimate response variation.
The Z-Score is inversely proportional to your desired confidence level. Our sample size calculator automatically sets these values based on your selection, considering available resources and research needs.
Our calculator uses these standard Z-Scores:
Tip: You don’t need to memorize these values – our calculator handles them automatically based on your confidence level selection.
When conducting a survey, it’s important to talk to the right number of people. Too few responses won’t yield statistically significant results, while exceeding the recommended sample size wastes resources. Two primary methods help determine your survey sample size:
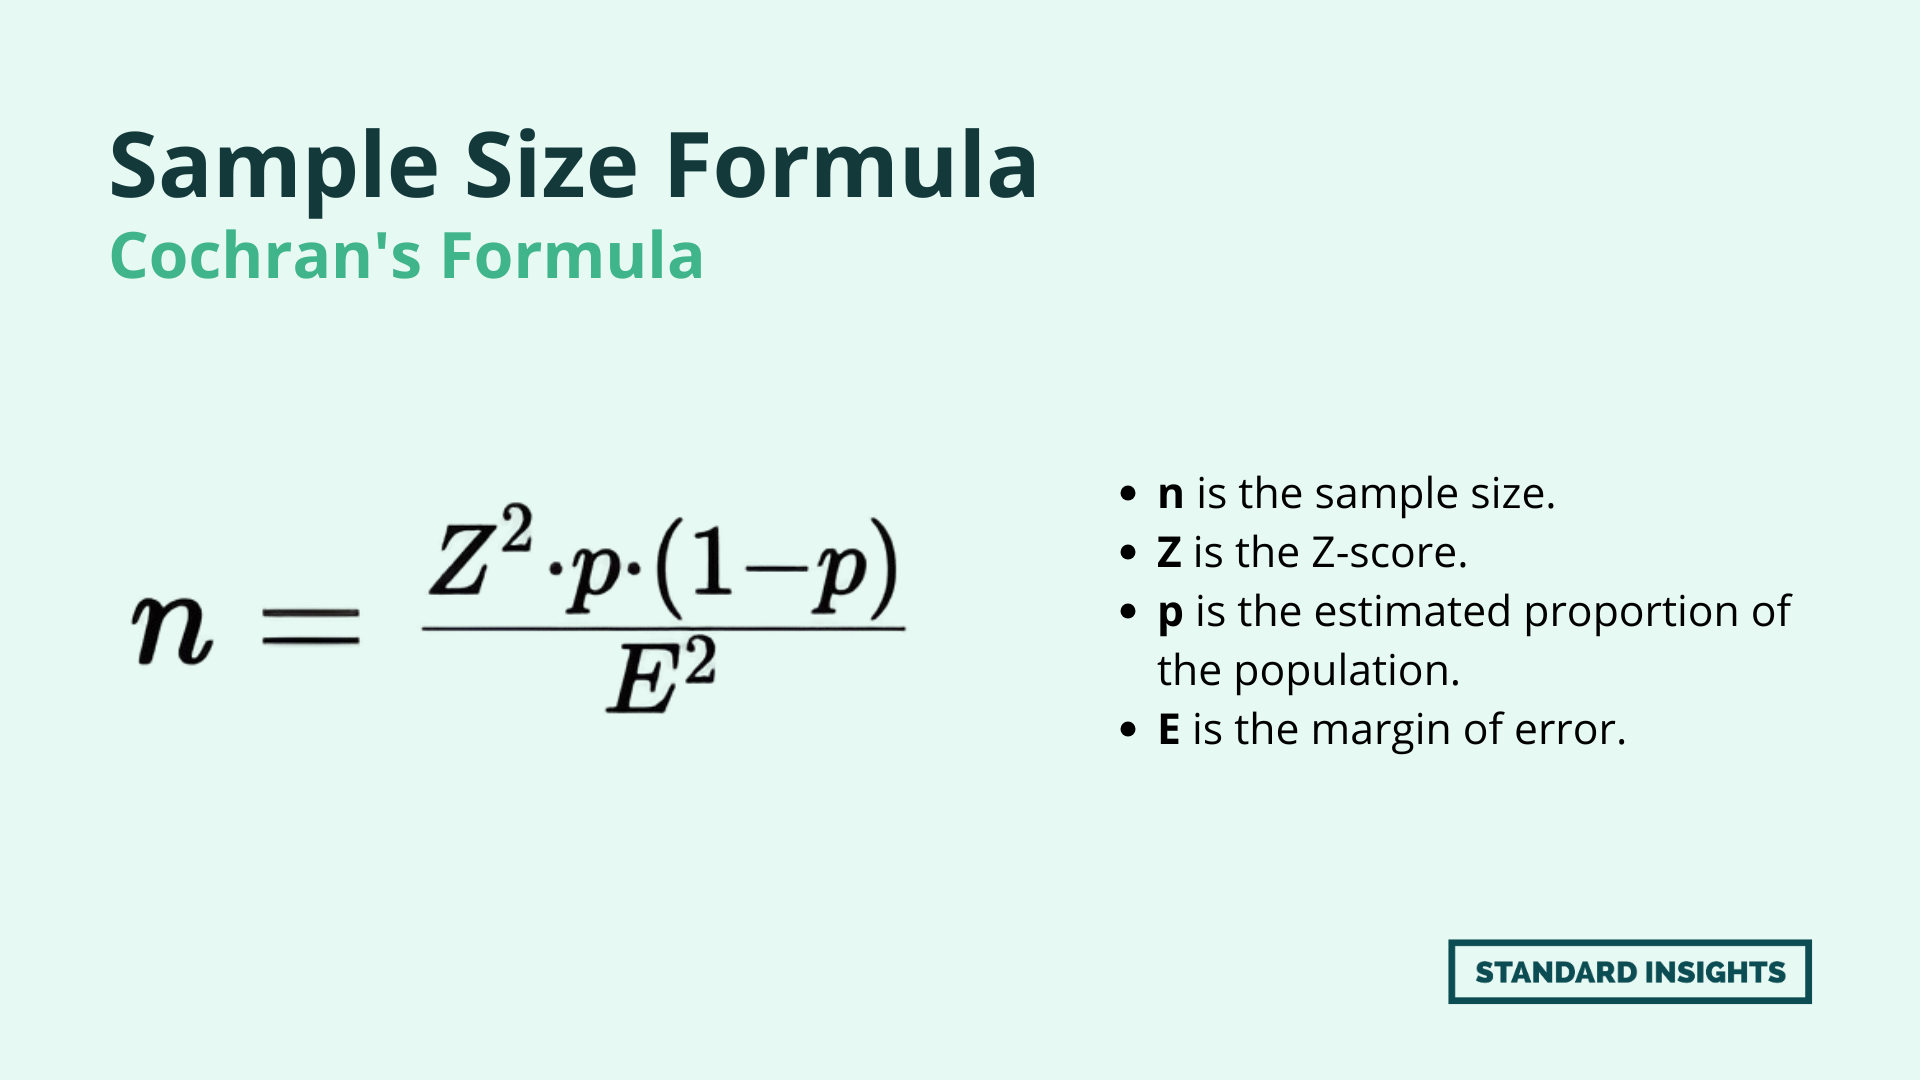
This advanced sample size calculation considers both confidence interval and margin of error. It’s ideal for:
Best for:
Cochran’s Formula in Excel:
=ROUNDUP((POWER(NORM.INV((1 + [Confidence Level])/2, 0, 1), 2) * 0.25) / POWER([Margin of Error], 2), 0)
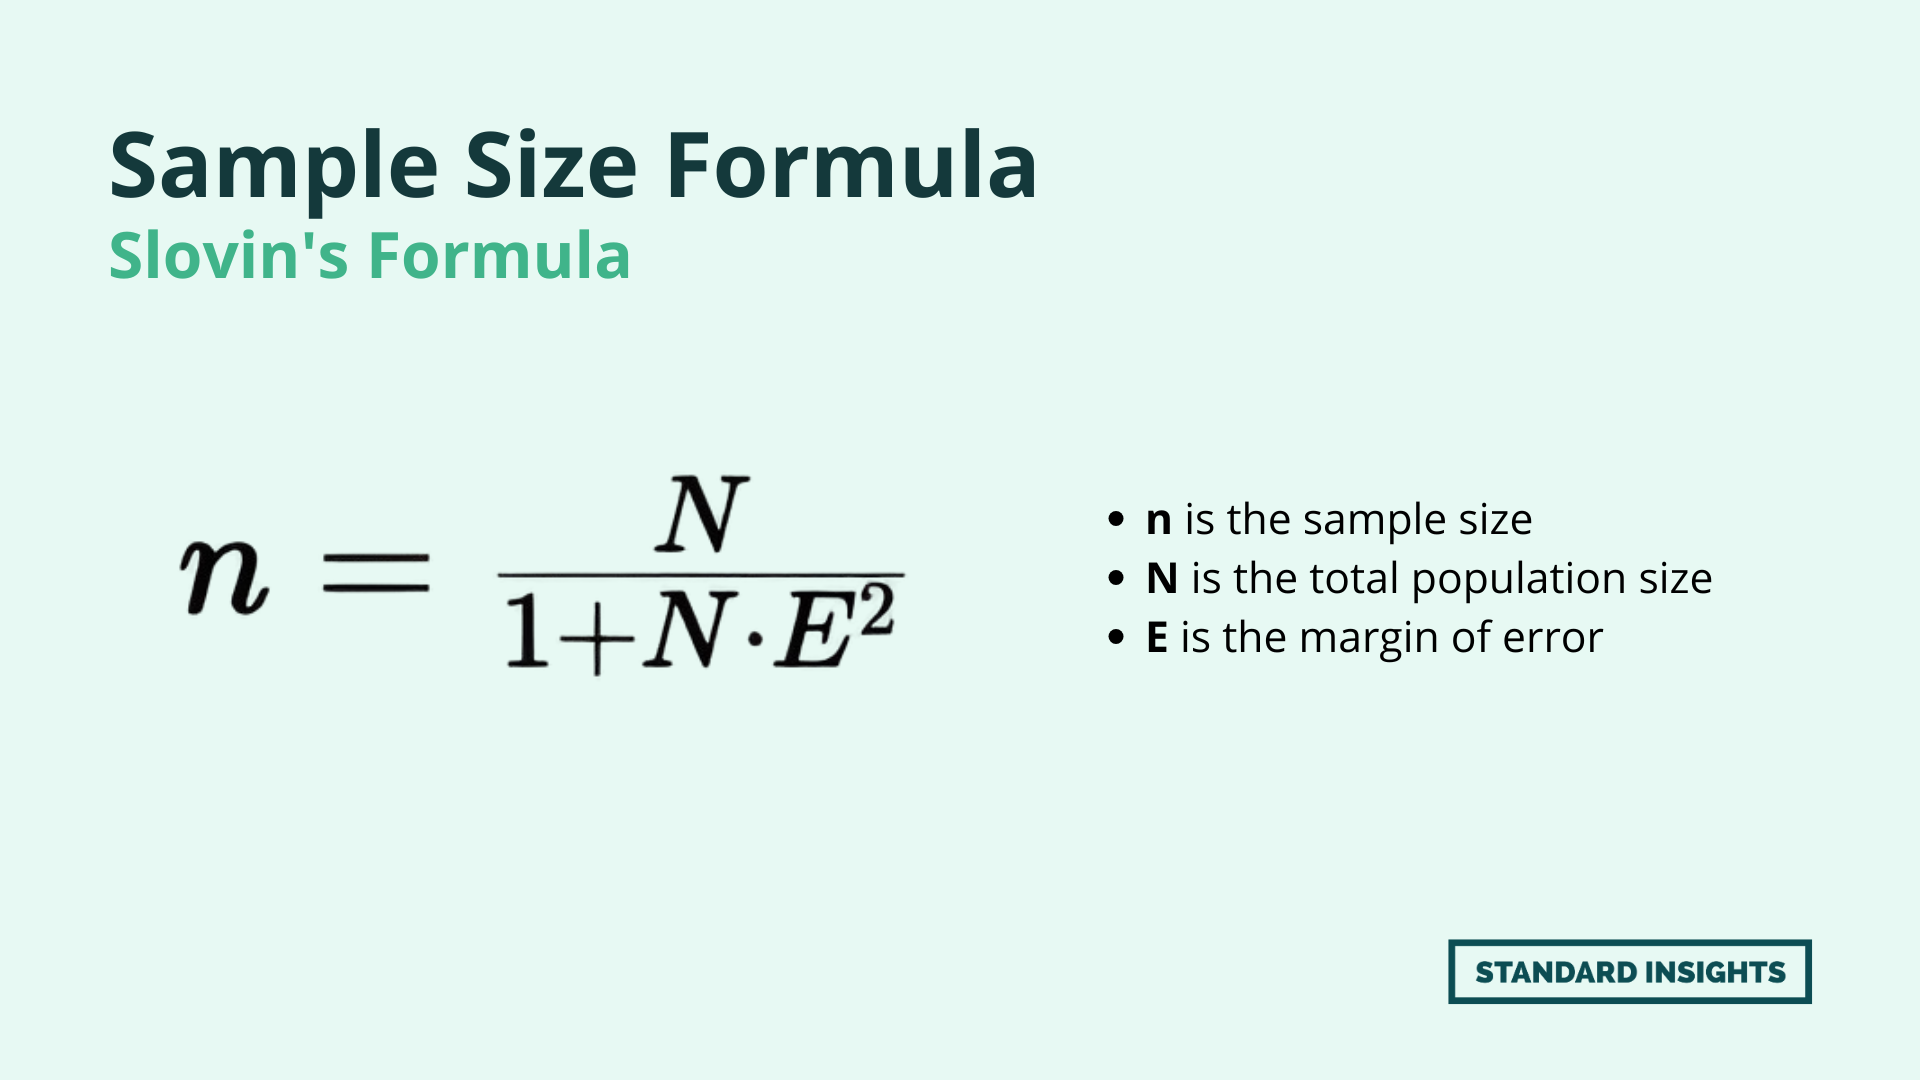
A simpler approach that only requires your population size and desired margin of error. While less precise than Cochran’s formula, it’s easier to calculate and understand.
Best for:
Slovin’s Formula in Excel
					=ROUNDUP(
    [Population Size] /
    (1 + [Population Size] * POWER([Margin of Error], 2)), 0)
Yes, the number of people you need to survey can differ depending on the method you use.
Here’s an example using a school with 1,000 students:
Slovin’s formula
n = 1000 / (1 + 1000 * 0.05^2)
n = 1000 / (1 + 1000 * 0.0025)
n = 1000 / (1 + 2.5)
n = 1000 / 3.5
n ≈ 285.71
Cochran’s formula
n₀ = (1.96^2 * 0.5 * 0.5) / 0.05^2
n₀ = (3.8416 * 0.25) / 0.0025
n₀ = 0.9604 / 0.0025
n₀ ≈ 384.16
Slovin’s formula produces a smaller margin while Cochran’s formula typically suggests a larger sample size to ensure more statistically significant results.
Choosing between Cochran’s and Slovin’s formula depends on your specific research needs and the characteristics of your population:
Cochran’s formula is a better choice if your population is large and you do not know the standard deviation. It’s also more suitable when you need a more conservative sample size.
If your population size is small and known, Slovin’s formula can be used, as it’s less conservative and simpler to use.
In both cases, it’s essential to consider the confidence level you want in your results and the margin of error you’re willing to accept. These factors will also influence the size of the sample you need.
A sample size becomes statistically significant when it can reliably detect meaningful differences or relationships in your study. For most research, this means having at least a 95% confidence level and a 5% margin of error. While the exact number varies by project, you generally need at least 30 participants for basic statistical analysis, and in small populations, your sample should represent at least 10% of the total group.
Yes, a small sample can be representative if it accurately reflects your population’s characteristics. What matters most is how you select your participants, not just how many you have. While smaller samples can work, they usually have a higher margin of error and might miss subtle differences in your population.
Slovin’s formula is simpler and only needs population size and margin of error to calculate sample size. The standard sample size formula is more complex but more accurate as it also considers confidence level and population proportion. Choose Slovin’s for quick estimates and the standard formula for more precise research.
Use 90% for preliminary or exploratory research, 95% for most standard research (it’s the most commonly accepted), and 99% when you need extremely reliable results, such as in medical studies or critical decision-making.
Yes, match your sample size to your research needs. Basic market exploration might work with a ±10% margin of error, while crucial business decisions usually need ±3-5%. Consider:
Yes, surprisingly, once your population reaches a certain size (usually above 20,000), the required sample size stays relatively stable. This means you might need similar sample sizes whether surveying a city or an entire country.
Use our Confidence Interval Calculator for quick, reliable estimates from your sample data. Ideal for data-driven decisions in research and analysis.
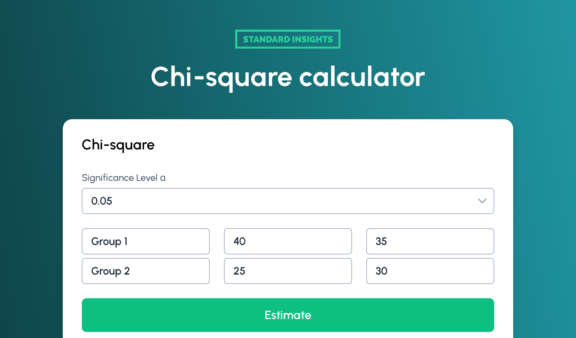
Analyze categorical data quickly with our Chi-Square Calculator. Get fast results and insights into variable relationships with ease.
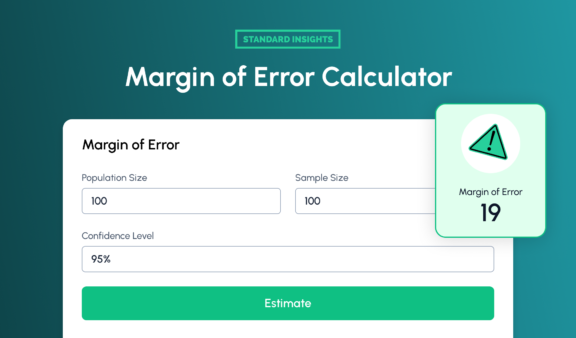
Easily determine the margin of error for your survey results using sample size, population, and confidence level.
Book a personalized demo with our team and receive free access credentials shortly thereafter.