
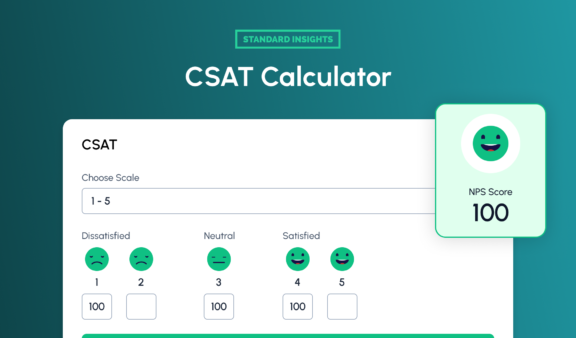
Instantly calculate your Customer Satisfaction Score (CSAT) based on satisfied, neutral, and dissatisfied responses.
Measure your survey response rate instantly with our free Response Rate Calculator
Enter the number of surveys sent and responses received below:
The Response Rate measures the percentage of people who completed your survey out of the total number of surveys sent. It’s a key metric for understanding engagement and the effectiveness of your survey distribution.
A high response rate isn’t just a number—it’s a sign of effective communication and strong customer engagement.
Here’s why it matters:
Example: A company that increased its response rate from 10% to 25% saw a significant improvement in the accuracy of its customer insights.
As a general guideline, response rates typically range from 20% to 30%, with 50% or higher considered excellent. However, there’s no one-size-fits-all answer, as good survey response rates depend on various factors. You can see our estimated survey response rate examples by industry below.
| Industry | Average Response Rate | Good Response Rate | Excellent Response Rate |
|---|---|---|---|
| Ecommerce & Retail | 10-15% | 20%+ | 30%+ |
| Technology | 15-20% | 25%+ | 35%+ |
| Healthcare | 10-15% | 20%+ | 30%+ |
| Financial Services | 15-20% | 25%+ | 35%+ |
| Education | 20-25% | 30%+ | 40%+ |
| Nonprofits | 15-20% | 25%+ | 35%+ |
| Hospitality & Tourism | 10-15% | 20%+ | 30%+ |
| B2B (Business-to-Business) | 20-25% | 30%+ | 40%+ |
| Consumer Goods | 10-15% | 20%+ | 30%+ |
| Telecommunications | 10-15% | 20%+ | 30%+ |
This challenge is often referred to as the incidence rate, which indicates the percentage of your target audience that qualifies to participate in your survey. Niche audiences can be particularly difficult to engage, often resulting in smaller sample sizes and potentially lower response rates. For example, it’s generally easier to get responses from passengers on a plane than from pilots, who may be less accessible.
For more detailed insights and tools, visit our Incidence Rate Estimator.
The design of your survey also plays a crucial role in influencing response rates. Key aspects include:
For example, a Net Promoter Score (NPS) survey conducted just before landing is likely to achieve higher completion rates than a lengthy 60-minute survey administered before takeoff.
Many other criteria can impact response rates, such as:
Step 1: Collect Data
Track the number of surveys sent and responses received.
Step 2: Use the Formula
Response Rate = (Number of Responses / Number of Surveys Sent) × 100
Example: If you sent 200 surveys and received 50 responses, your response rate is 25%.
Explore various methods to effectively gather feedback directly from your customers.
Surveys with fewer questions are more likely to be completed, as they require less time and effort from respondents.
Avoid jargon and complex terms. Make questions clear and easy to understand to encourage more responses.
Send surveys at times when customers are most likely to engage, such as shortly after a purchase or interaction.
Attract participants by providing discounts, rewards, or entries into a prize draw for completing the survey.
Utilize multiple platforms like email, SMS, in-app notifications, or social media to reach a broader audience.
Ensure your survey is mobile-friendly, as many users prefer to complete surveys on their smartphones or tablets.
Conduct a pilot test to identify and fix any issues before launching it to your entire audience, ensuring a smoother experience.
Show respondents how far along they are in the survey. This reduces anxiety and encourages them to complete it.
Instantly calculate your Customer Satisfaction Score (CSAT) based on satisfied, neutral, and dissatisfied responses.
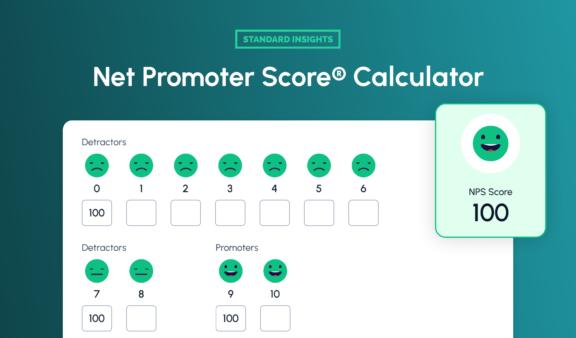
Calculate your Net Promoter Score instantly with our free NPS calculator. Measure customer loyalty, interpret results, and boost satisfaction.
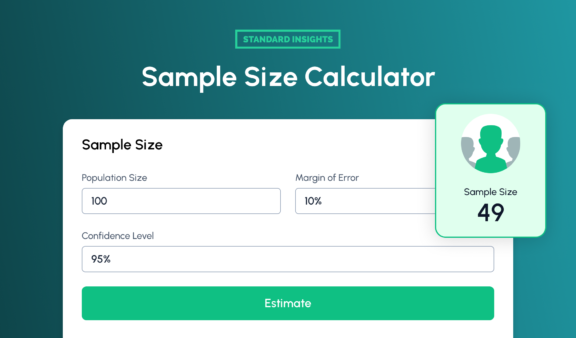
Quickly calculate the ideal sample size for your study based on confidence level, margin of error, and population size.
Create your free account, and use our set of tools to conduct your research easily.