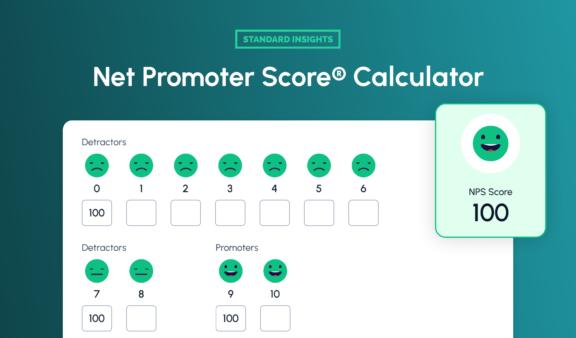
Calculate your Net Promoter Score instantly with our free NPS calculator. Measure customer loyalty, interpret results, and boost satisfaction.
Simplify your statistical analysis with our advanced Chi-square Calculator and test independence of categorical variables.

Input group names and their corresponding values as comma-separated numbers (e.g., 32, 30).

Choose your desired significance level (e.g., 0.05) from the dropdown menu.

Click the "Calculate" button to instantly view the Chi-square value, P-value, and a detailed summary table of the results.
The Chi-square test is a statistical method used to test the independence between two categorical variables. It helps to determine if observed differences between categories are due to random chance or represent a significant association.
The Chi-square test is widely used in research fields like marketing, psychology, sociology, and others. For instance, you might use a Chi-square test to examine if there is a significant difference in the proportion of men and women preferring a certain product.
This calculator focuses on the Chi-Square Test of Independence for comprehensibility and user-friendliness.
Our Chi-Square Calculator makes the following computations:
In the results:
The significance level (alpha, α) is a threshold set before the study that defines the probability of wrongly rejecting the null hypothesis if it is true. Commonly set to 0.05, it implies that there is a 5% risk of wrongly rejecting the null hypothesis. If the p-value is less than α, you reject the null hypothesis and conclude that there is significant evidence to suggest an association between the variables.
Yes, the Chi-square test can be used for more than two categories or groups. The test is flexible and can be used to analyze the relationship between two categorical variables, each of which may have two or more levels. For example, you could use a Chi-square test to see if there's a relationship between type of diet (vegetarian, pescatarian, omnivore, etc.) and health outcomes (healthy, unhealthy).
The Chi-square test assumes that data are randomly sampled, the variables are categorical, and that you have an adequate sample size (usually an expected frequency of 5 or more in each cell of a contingency table). If these assumptions are not met, the Chi-square test may not be the most appropriate choice.
If your data does not meet these assumptions, you may need to choose a different statistical test. For example, if your data are not categorical, a different test like a t-test or an ANOVA might be more appropriate. If you have small sample sizes, Fisher's exact test might be a better choice than the Chi-square test.
Always consider consulting with a statistician or a knowledgeable adviser to determine the best statistical method for your research.

Calculate your Net Promoter Score instantly with our free NPS calculator. Measure customer loyalty, interpret results, and boost satisfaction.

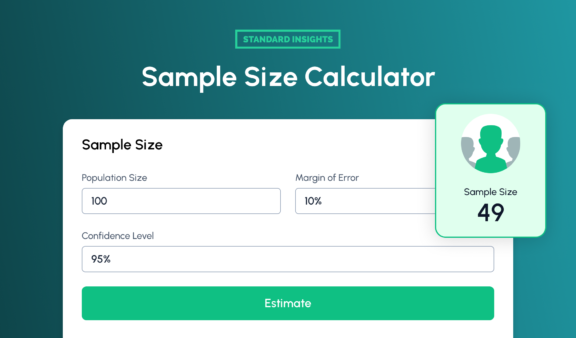
Quickly calculate the ideal sample size for your study based on confidence level, margin of error, and population size.

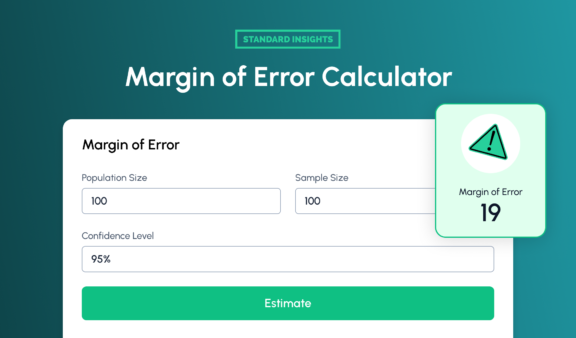
Easily determine the margin of error for your survey results using sample size, population, and confidence level.
Create your free account, and use our set of tools to conduct your research easily.