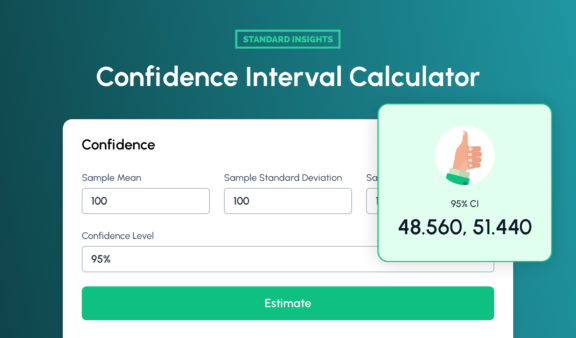
Use our Confidence Interval Calculator for quick, reliable estimates from your sample data. Ideal for data-driven decisions in research and analysis.
Simplify your statistical analysis with our advanced One-way ANOVA Calculator and calculate the differences between two means.
Update the levels or replicates and click "Generate Table" below:

Input group names and their corresponding values as comma-separated numbers (e.g., 5, 1, 11, 2, 8).

Choose your desired significance level (e.g., 0.05) from the dropdown menu.

Click the "Calculate" button to instantly view the F-statistic, P-value, and a detailed summary table of the results.
ANOVA (Analysis of Variance) is a statistical method used to compare the means of two or more groups to determine if there are significant differences between them. It helps answer the question: “Are the observed differences between group means due to random chance or a real effect?”
ANOVA is widely used in fields like psychology, biology, business, and more, where comparing group performance or outcomes is essential. For example, you might use ANOVA to compare the test scores of students from different schools or the effectiveness of various marketing strategies.
Examples of when to use ANOVA:
One-Way ANOVA
This is used when comparing the means of three or more groups based on one independent variable (e.g., testing different teaching methods).
Two-Way ANOVA
This is used when analyzing the effect of two independent variables on a dependent variable (e.g., testing different teaching methods across different age groups).
Our calculator focuses on One-Way ANOVA for simplicity and ease of use.
Our ANOVA calculator performs the following steps automatically:
Calculates Group Means and Variability
It computes the mean, standard deviation, and standard error for each group, as shown in the Data Summary table.
Breaks Down Variance
It separates the total variance into two components:
Computes the F-Statistic and P-Value
The F-statistic is the ratio of between-group variance to within-group variance. The P-value indicates if the observed differences are statistically significant.
In the example above:
Understand how different groups respond to your products. Track satisfaction across age groups, regions, and demographics for better targeting and improved experiences.
Test product versions with confidence. See which features perform best and how satisfaction varies across product lines.
Evaluate campaign effectiveness across channels. Identify which messages resonate and optimize your marketing budget.
Analyze price sensitivity across markets. Determine optimal pricing strategies for different segments.
Track brand perception across different markets. Measure awareness, loyalty, and competitive position.
Identify and analyze distinct customer groups. Understand behavior patterns and preferences.
The significance level (alpha) is the threshold for determining statistical significance. Common values are 0.05 (5%) or 0.01 (1%). A P-value below α means the results are significant.
While ANOVA works for two groups, a t-test is generally more appropriate. ANOVA is most useful for comparing three or more groups.
ANOVA assumes that your data is normally distributed and that variances across groups are equal. If these assumptions aren’t met, consider using non-parametric tests like the Kruskal-Wallis test.

Use our Confidence Interval Calculator for quick, reliable estimates from your sample data. Ideal for data-driven decisions in research and analysis.

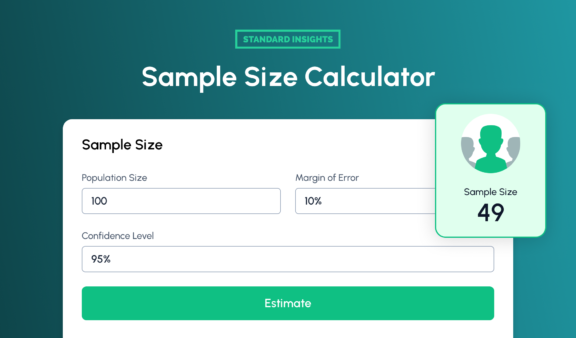
Quickly calculate the ideal sample size for your study based on confidence level, margin of error, and population size.

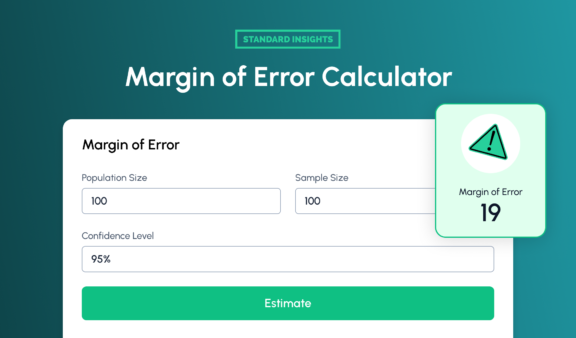
Easily determine the margin of error for your survey results using sample size, population, and confidence level.
Book a personalized demo with our team and receive free access credentials shortly thereafter.