This Indonesia report offers a comprehensive view of consumer sentiment and behavior, highlighting economic, social, and personal challenges. Based on a survey of 30 questions covering 6 main categories, this report will benefit decision-makers seeking to understand the Indonesian market and its consumers.
Reflection on 2024
The satisfactions and challenges of the previous year, both as an individual and as a nation.
Expectations for 2025
The financial goals, hopes about the future, and confidence in the economic outlook of Indonesia.
Industry consumption
Current consumption and ownership in various industries such as consumer goods, travel, housing, automotive, and banking.
Purchasing plans
Intent to purchase in various industries such as consumer goods, travel, housing, automotive, and banking.
Workplace Sentiment
Feelings about one's current job, and what is most desired.
Attitudes Toward AI
The state of AI adoption in Indonesia and people's thoughts and feelings about its impact.
How to get the most of the consumer report Indonesia?
This new edition of the Consumer Report Indonesia comes in a new format. Our interactive dashboard isn’t just about numbers—it’s about putting YOU in control. Whether you’re here to explore, analyze, or strategize, we’ve designed every feature to make it easy, engaging.
Here’s what you’ll love:
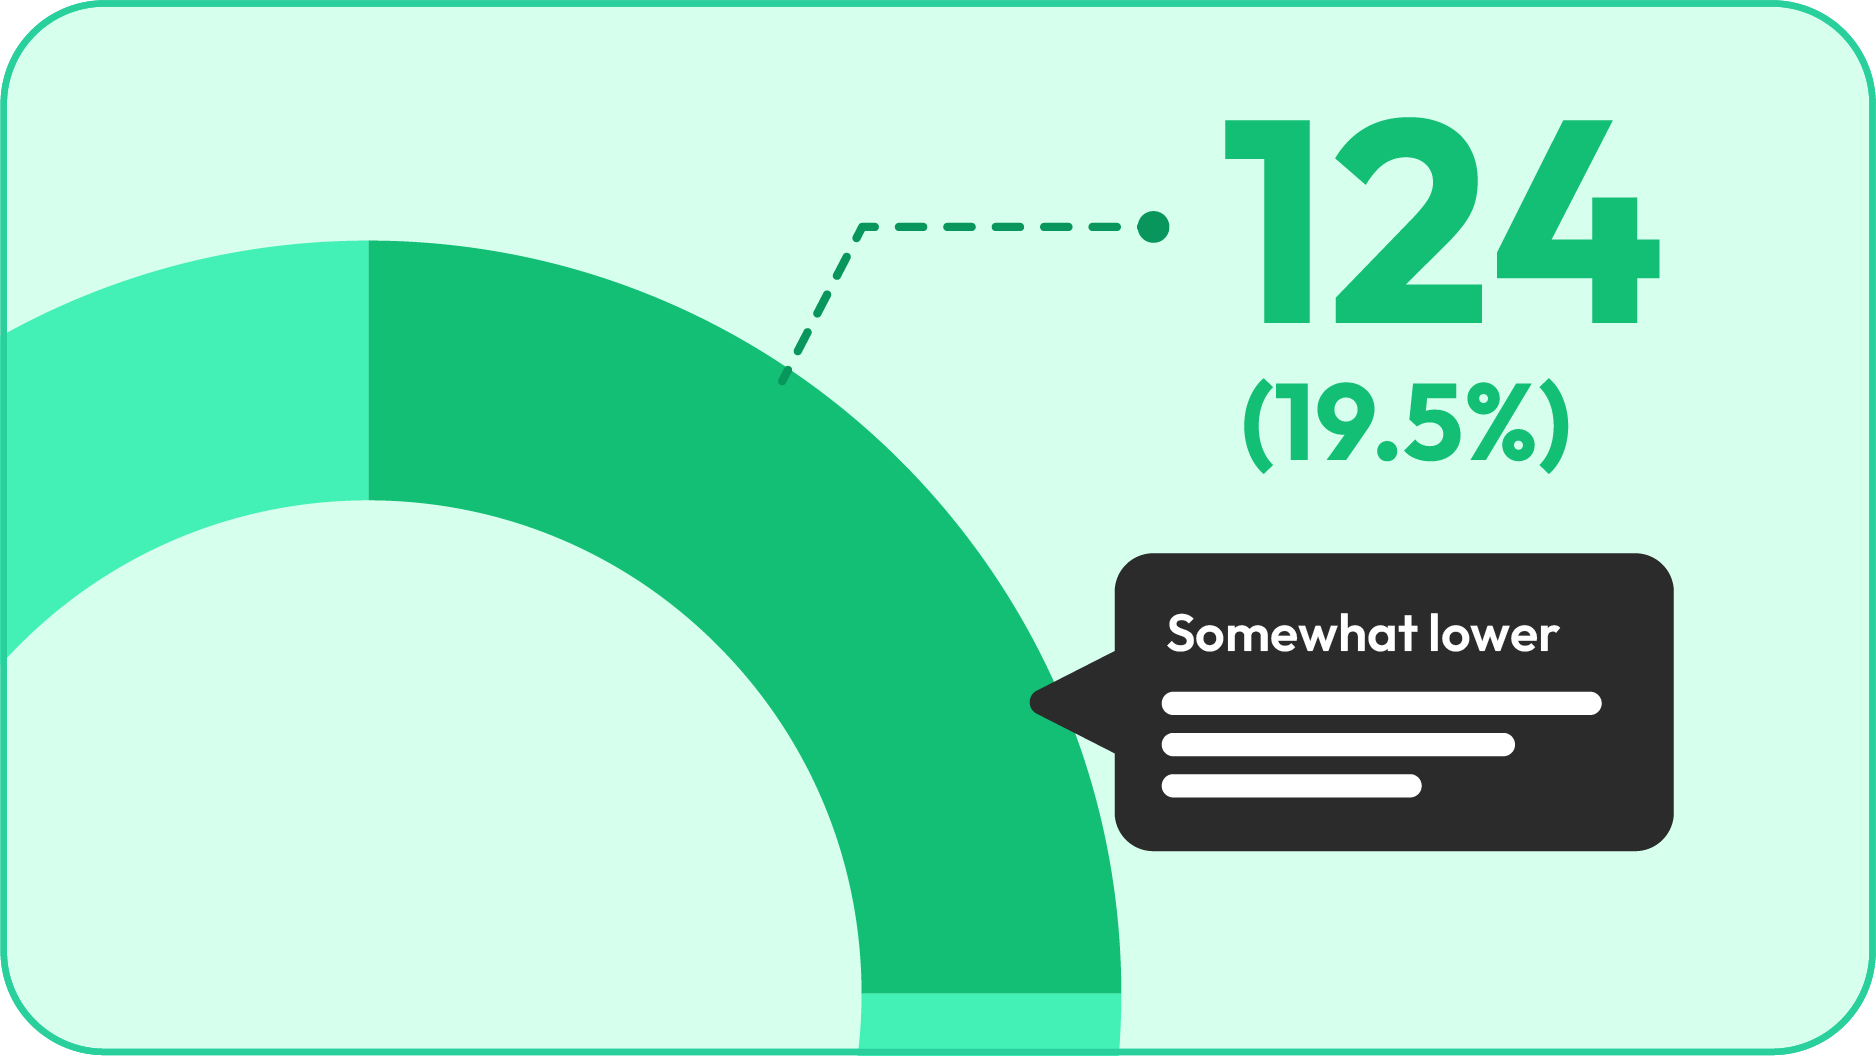
Hover for details
Curious about a data point? Hover over it. See the story behind the number in an instant.
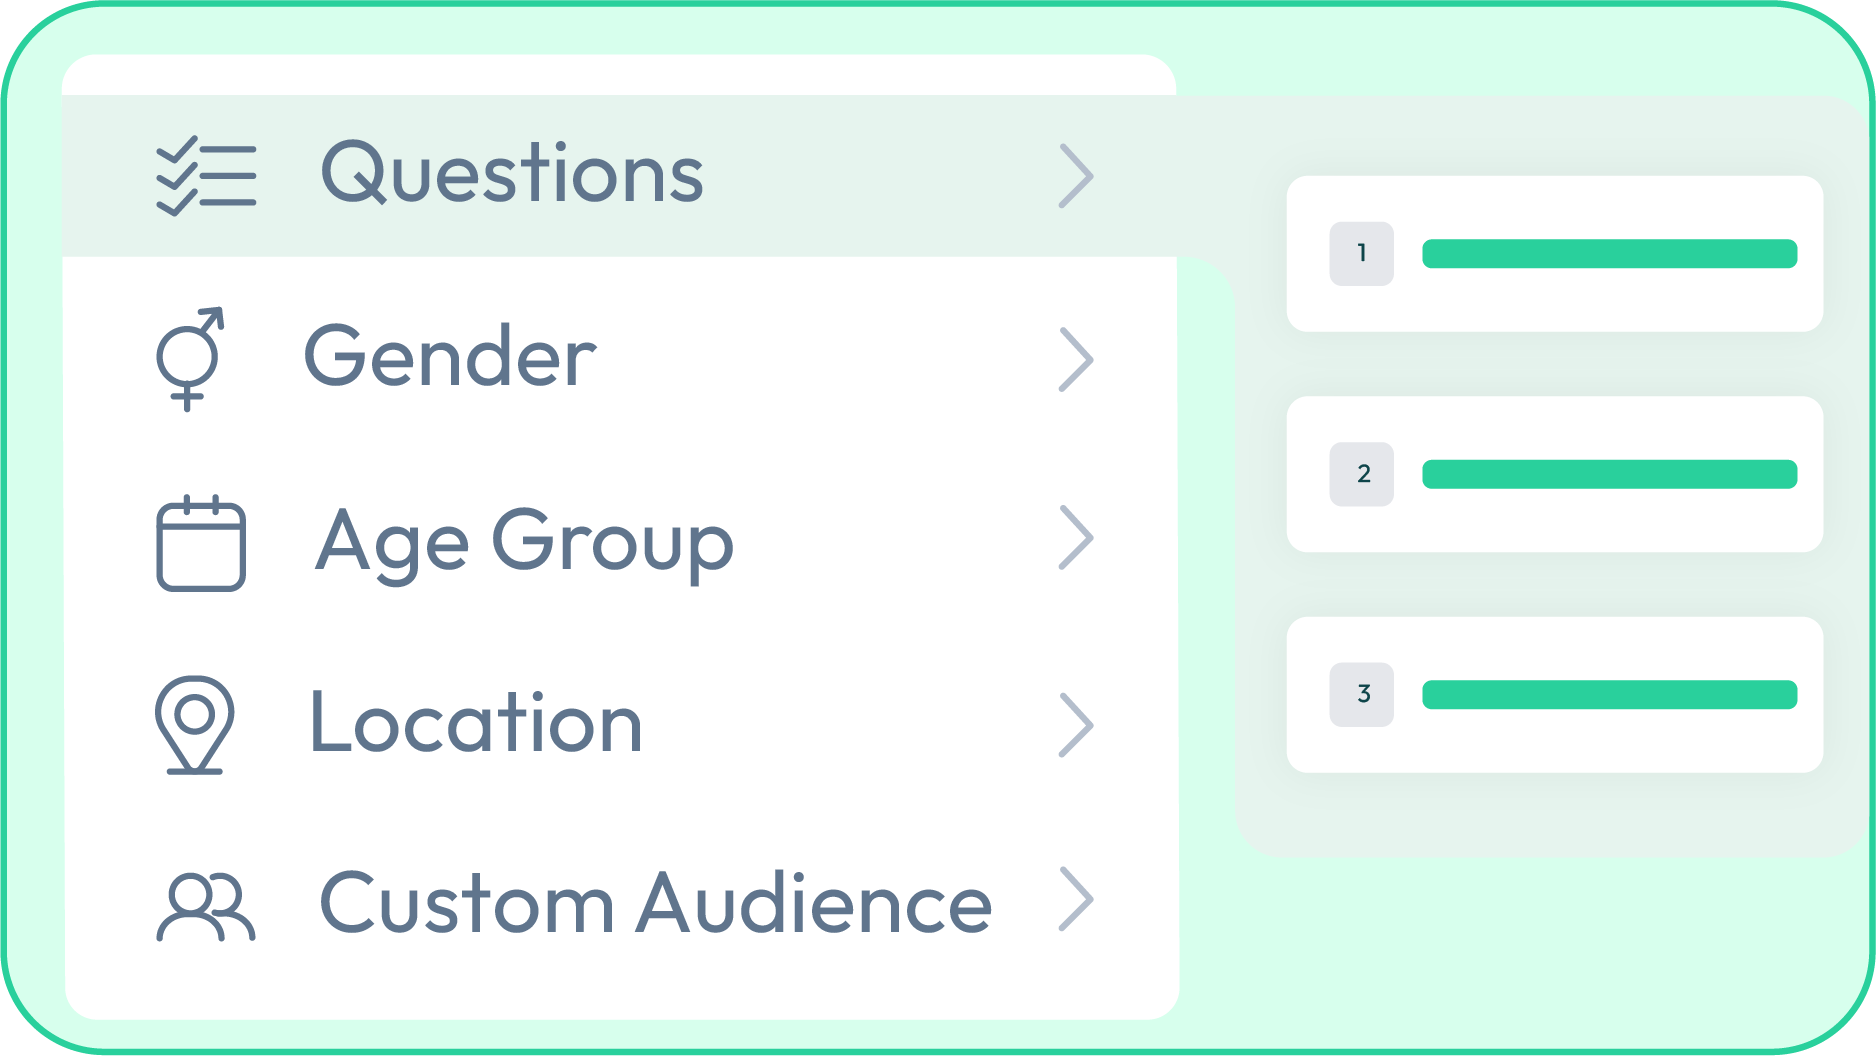
Filter and customize
Slice and dice the data YOUR way. By age, location, or even spending habits. Your focus, your rules.
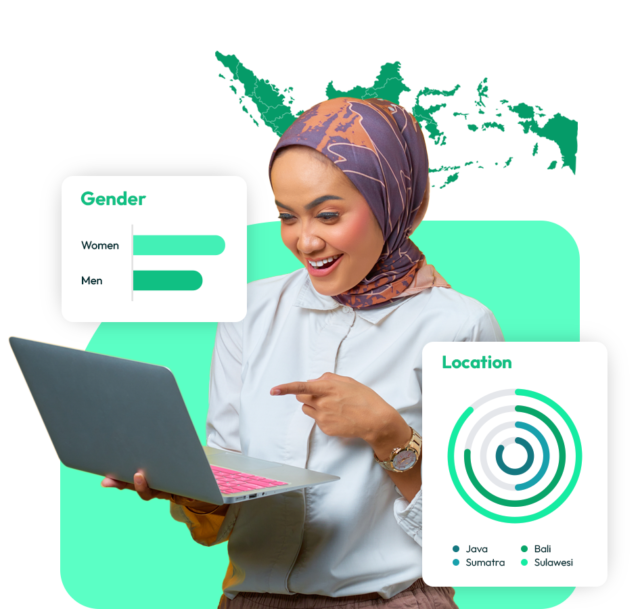
In January 2025, we surveyed 635 individuals across Indonesia, representing a range of ages, genders, and locations, to capture the country’s diverse perspectives.
We excluded participants under 18, as they are generally not considered independent consumers.
We collected the data ourselves through our customized methodology, sourcing participants online from various social media and entertainment platforms. All qualified participants entered a lucky draw for a chance to win various gifts.
To ensure the quality of the data, the survey included red herrings, traps, and consistency checks. Respondents who did not pass these checks were eliminated from the final analysis.
Base: 635 respondents — Indonesia — Fieldwork: January 2025. Online recruitment with multi-source sampling and 12+ quality checks. Percentages shown to encourage exploration in the interactive dashboard.