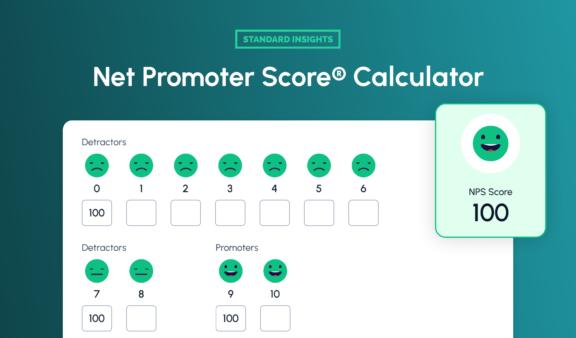
![Net Promoter Score Calculator](https://standard-insights.com/wp-content/uploads/2025/02/Net-Promoter-Score-Calculator-600x338.png)
Quickly calculate your Net Promoter Score (NPS) based on promoter, passive, and detractor responses.
Determine the precision of your survey findings with this margin of error calculator. Enter key survey values below, and we will compute the margin of error.
Margin Of Error
Shoot for a 2-7% Margin of Error.
The lower, the better.
The margin of error (MOE)—also called the confidence interval—determines how confident you can be in your survey results in demonstrating the perspectives of the entire population. Note that the act of surveying entails an in-between balance of using a smaller group (your survey respondents) to represent a much larger one (the target market or total population).
The margin of error is a range of values below and above the actual results of a survey. For instance, a 70% “yes” response with a margin of error of 5% means that 65% and 75% of the general population think the answer is “yes.”
The more responses you get (or the larger your random sample), the smaller your margin of error will be, and the more confidence you will have in sample results that are reliable and representative.
On the other hand, the larger your margin of error, the further your results can diverge, lowering the likelihood of trustworthy survey results.
Researchers should thus aim for a lower margin of error because it denotes higher confidence in a survey results’ accuracy, which debilitates descriptive and qualitative research.
There will always be the presence of uncertainty and imprecision since a sampling pool (your survey respondents) represents a larger population, while survey samples represent a chunk of your target population.
The existence of MOE, hence, is to calculate this inherent imprecision, which allows researchers to see how conclusive their survey results represent a particular population.
In addition to that, the MOE is also beneficial when you can not record responses from every person you want to survey. For example, polling the entire population of Hong Kong is not feasible. However, you can pick out a set of people representative of that group and then base your survey results on them.
MOE helps you determine the accuracy of a value by expressing it in a range, which represents the answer in relation to the entire target population.
Generally speaking, the calculation of MOE will help specify the likelihood that your survey result is close to the result had the whole population been surveyed. Its value goes a long way in determining the accuracy level of your survey.
Most researchers who prefer statistically significant results look for a 5% or lower MOE. Feel free to play around with the margin of error calculator above. It can help you determine what sample size provides the MOE that best fits the needs of your unique project.
The relationship between the margin of error and sample size is inverse as the two move in opposite directions. When the sample size increases, the margin of error decreases, and vice versa.
Assume that the data were collected and handled correctly. The more information you get, the smaller your margin of error will be. In other words, your survey results will be more accurate.
The larger sample sizes decrease the margin of error but result in a diminished return. It means each time you poll one more person, the cost of your survey escalates accordingly.
The correct choice of research methodology helps in determining the success and overall quality of your research study and its documentation.
Therefore, it is crucial to choose the appropriate research methodology to underpin your work and methods you use that likely enhance the data’s reliability.
A methodology that drives quality insights must:
Standard Insights offers a methodology solution that meets all of the three key criteria above. Discover more here.
Quickly calculate your Net Promoter Score (NPS) based on promoter, passive, and detractor responses.
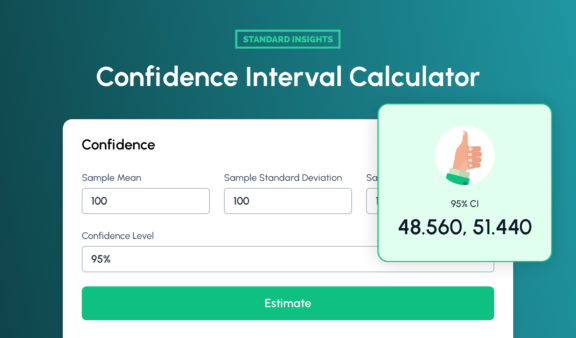
Use our Confidence Interval Calculator for quick, reliable estimates from your sample data. Ideal for data-driven decisions in research and analysis.
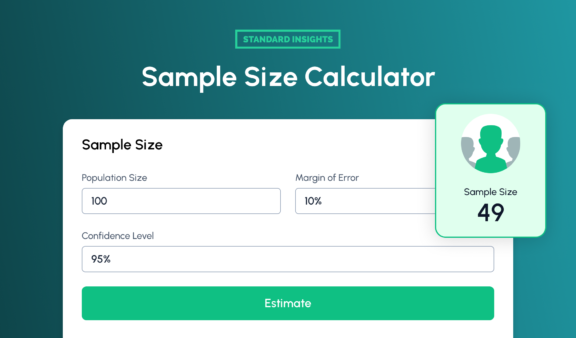
Quickly calculate the ideal sample size for your study based on confidence level, margin of error, and population size.
Book a personalized demo with our team and receive free access credentials shortly thereafter.