Picture of By Standard Insights
By Standard Insights

Consumer Report Vietnam 2025

Discover how Vietnamese consumers navigated 2024 and their 2025 expectations on various topics.

– Desktop only

Create a free account or log in to your account to access the full reports.

What's inside?

This Vietnam report offers a comprehensive view of consumer sentiment and behavior, highlighting economic, social, and personal challenges. Based on a survey of 31 questions covering 6 main categories, this report will benefit decision-makers seeking to understand the Vietnamese market and its consumers.

Men with a magnifying glass

Reflection on 2024

The satisfactions and challenges of the previous year, both as an individual and as a nation.

A women with a question mark on a green background

Expectations for 2025

The financial goals, hopes about the future, and confidence in the economic outlook of Vietnam.

A factory on a green background

Industry consumption

Current consumption and ownership in various industries such as consumer goods, travel, housing, automotive, and banking.

A house a car and a plane on a green background

Purchasing plans

Intent to purchase in various industries such as consumer goods, travel, housing, automotive, and banking.

Colleagues on a green background working on a computer

Workplace Sentiment

Feelings about one's current job, and what is most desired.

A robot on a computer with a green background

Attitudes Toward AI

The state of AI adoption in Vietnam and people's thoughts and feelings about its impact.

– Desktop only

How to get the most of the consumer report Vietnam? ​

This new edition of the Consumer Report Vietnam comes in a new format. Our interactive dashboard isn’t just about numbers—it’s about putting YOU in control. Whether you’re here to explore, analyze, or strategize, we’ve designed every feature to make it easy, engaging.

Here’s what you’ll love:
Data visualization showing segment of a donut chart with green gradient coloring. The highlighted section represents 124 responses (19.5%) labeled as 'Somewhat lower' with explanatory text in a black speech bubble. The chart appears to be displaying survey results measuring sentiment or comparative ratings. Design uses a minimalist style with clean typography against a light mint green background with rounded corners.

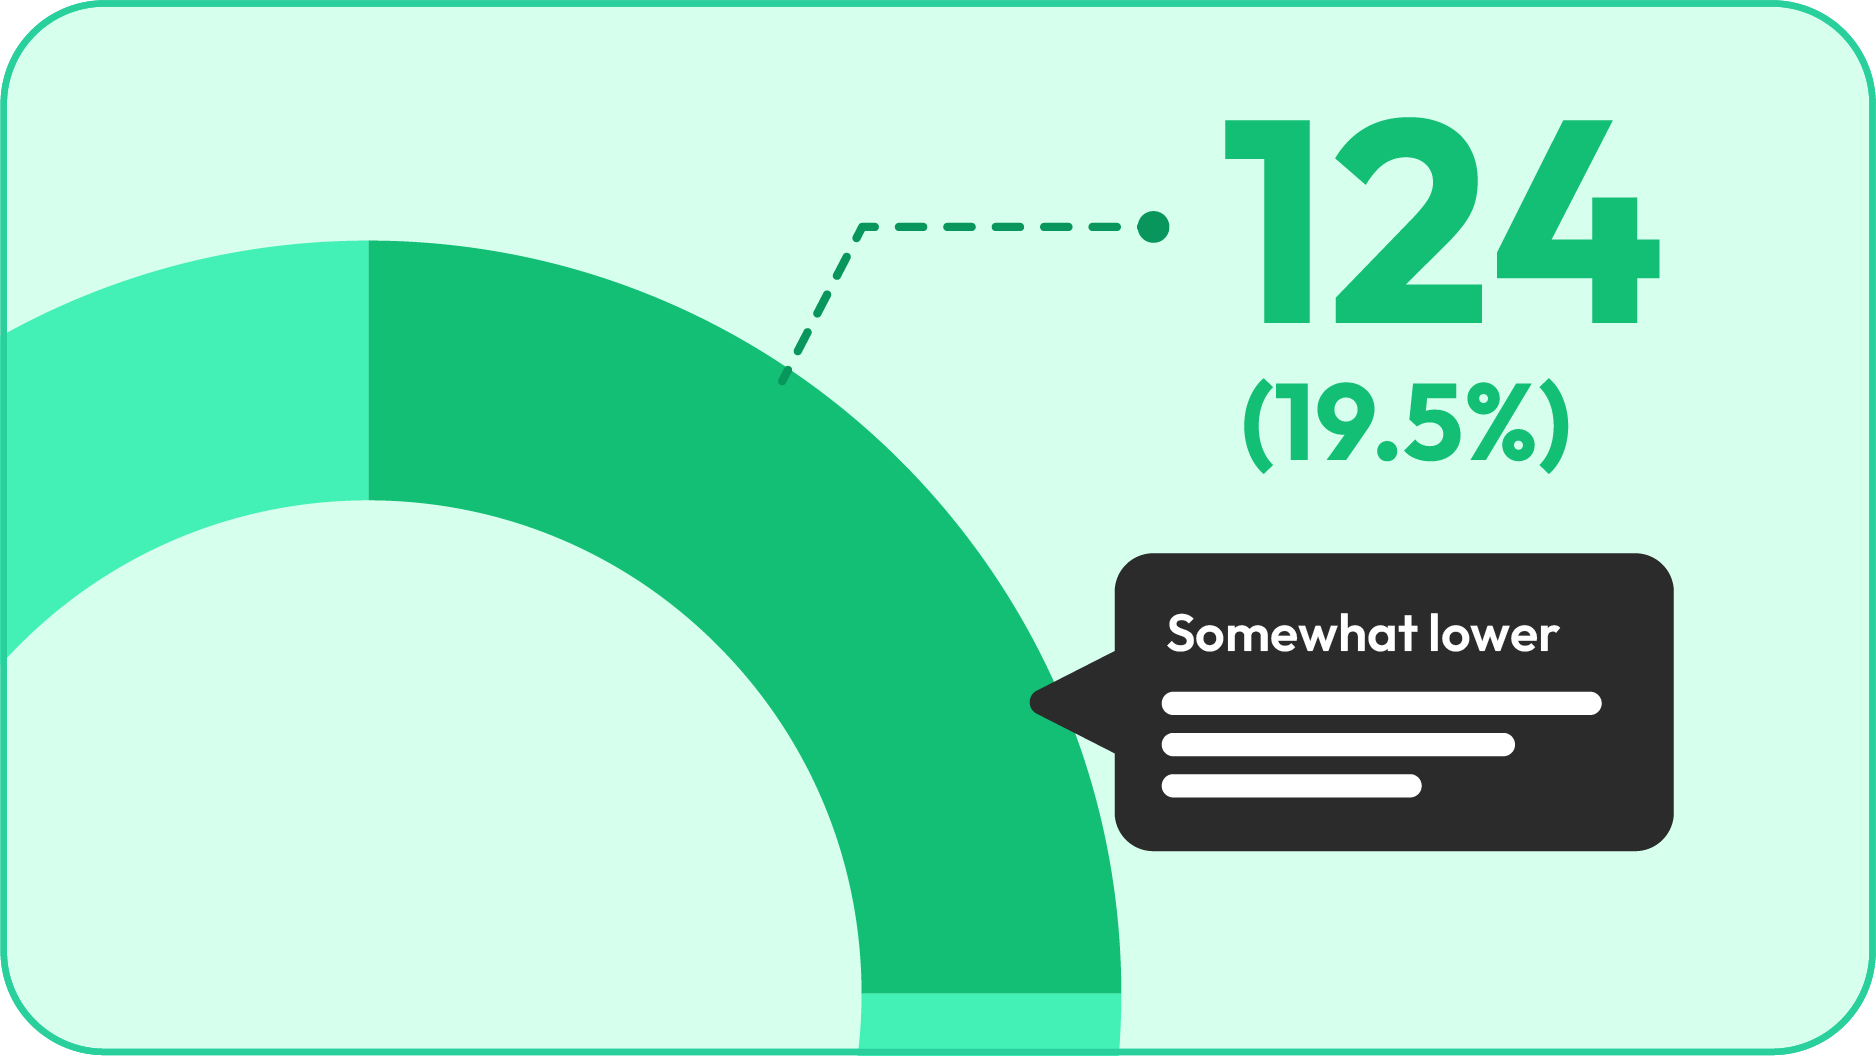
Hover for details

Curious about a data point? Hover over it. See the story behind the number in an instant.
Clean survey dashboard menu showing demographic filtering options. The interface displays five categories with icons: 'Questions' (checklist icon), 'Gender' (male/female symbol), 'Age Group' (calendar icon), 'Location' (map pin icon), and 'Custom Audience' (people icon). Each category has a right-facing chevron indicating expandable options. On the right side are three numbered progress indicators (1, 2, 3) with green completion bars. The design uses a minimalist style with slate blue text on a light mint green background with rounded corners.

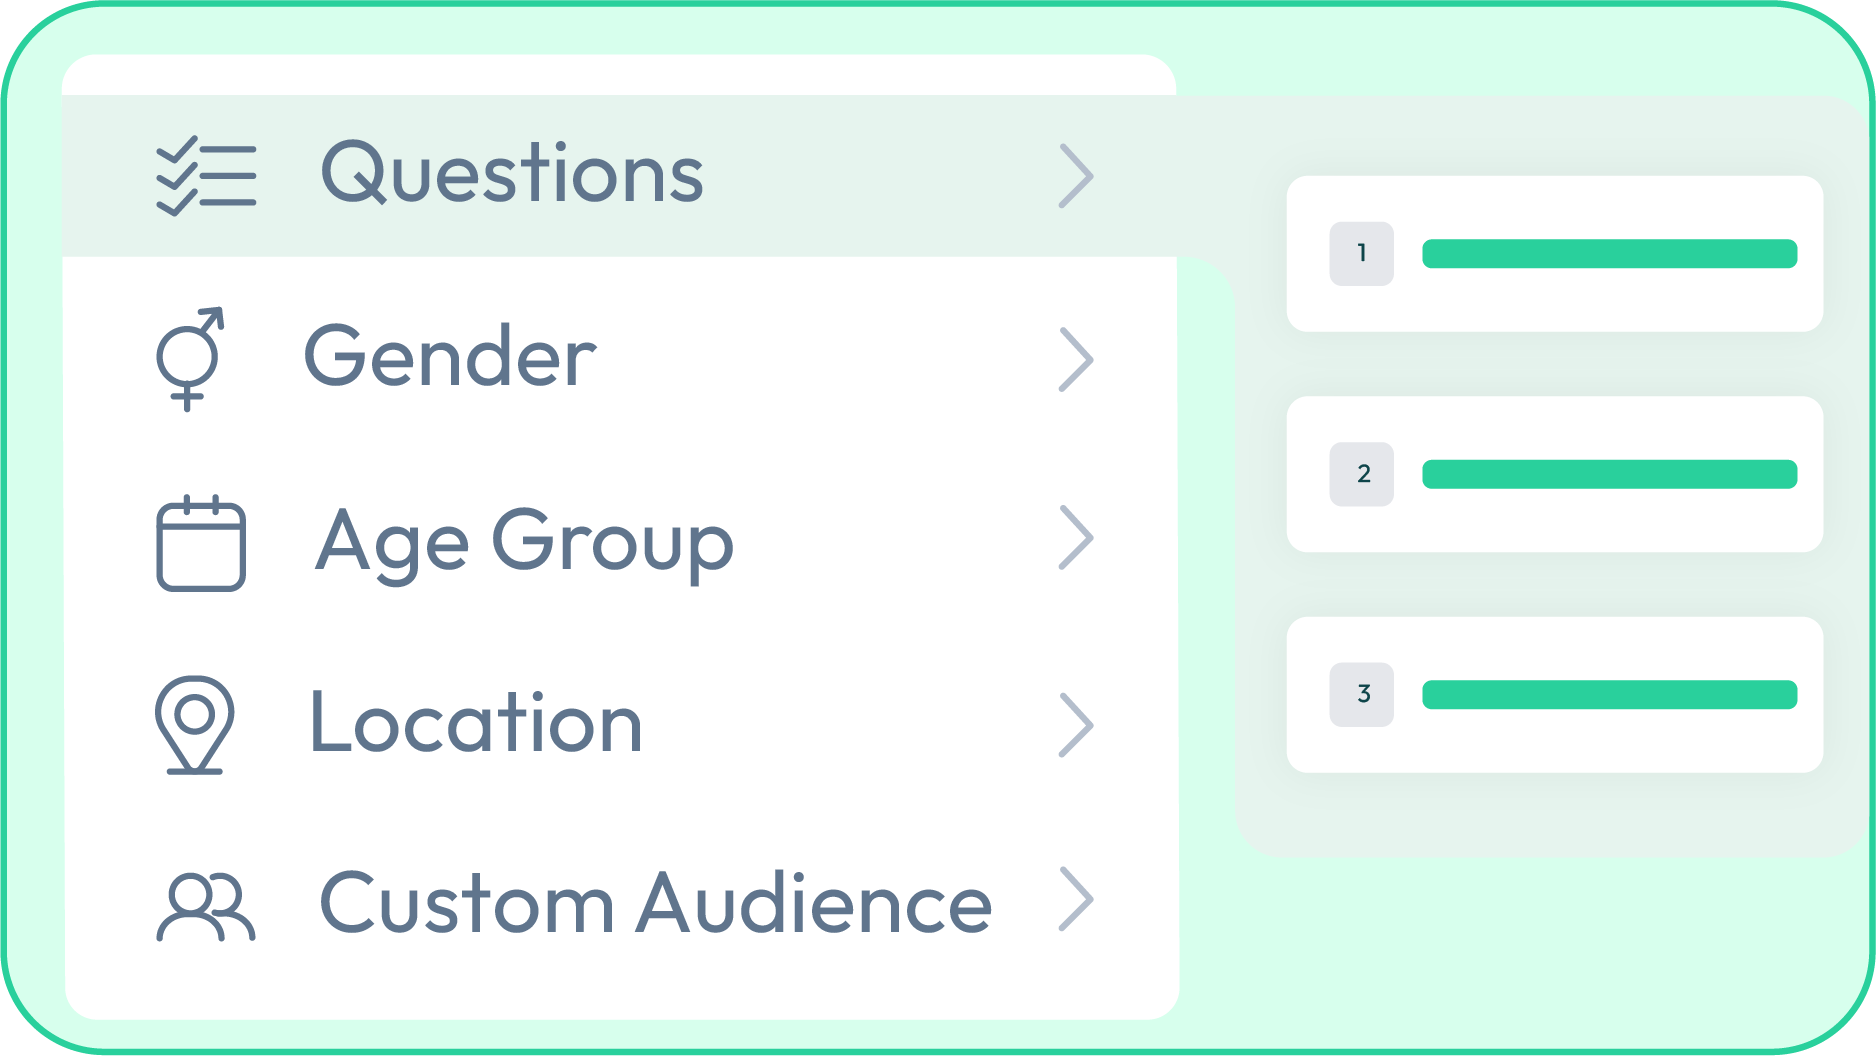
Filter and customize

Slice and dice the data YOUR way. By age, location, or even spending habits. Your focus, your rules.

Minimalist graphic illustration of a consumer report dashboard with 'Consumer Report' text centered at the top. Features simplified data visualization elements including a bar chart with three columns (light green, medium green, and dark blue/navy), a donut chart in the upper right, and stylized card/profile icons in green. Design uses a clean white background with green border and a modern teal and mint color palette. Represents a data analytics interface for consumer trend reporting.

Personalize it all

Create an account (it’s free!) to unlock color palettes, add comments, and export charts in the format you NEED.

– Desktop only

About the data

In January 2025, we surveyed 500 individuals across Vietnam, representing a range of ages, genders, and locations, to capture the country’s diverse perspectives.

We excluded participants under 18, as they are generally not considered independent consumers.

We collected the data ourselves through our customized methodology, sourcing participants online from various social media and entertainment platforms. All qualified participants entered a lucky draw for a chance to win various gifts.

To ensure the quality of the data, the survey included red herrings, traps, and consistency checks. Respondents who did not pass these checks were eliminated from the final analysis.

– Desktop only

More Consumer Reports

Are you an Agency or Consulting company?